PUBLISHER: Mordor Intelligence | PRODUCT CODE: 2124463

PUBLISHER: Mordor Intelligence | PRODUCT CODE: 2124463
Global Single Use Plastic Packaging - Market Share Analysis, Industry Trends & Statistics, Growth Forecasts (2026 - 2031)
According to Mordor Intelligence, the single-use plastic packaging market size is expected to grow from USD 49.23 billion in 2025 to USD 51.03 billion in 2026 and is forecast to reach USD 61.07 billion by 2031 at 3.66% CAGR over 2026-2031.
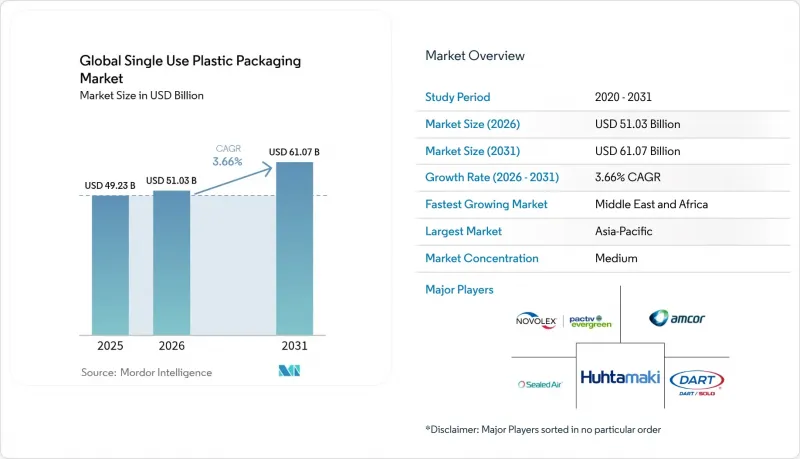
This report is Segmented by Material (Polyethylene Terephthalate (PET), Polyethylene (PE), and More), Product Type (Bottles, Pouches and Sachets, and More), End-Use Industry (Quick-Service Restaurants (QSR), Full-Service Restaurants (FSR), Food and Beverages, and More), Distribution Channel (Direct Sales, Indirect Sales), and Geography. The Market Forecasts are Provided in Terms of Value (USD).
Global Single Use Plastic Packaging Market Trends and Insights
App-based Food-Delivery Boom in Asian Megacities
Indonesia, Thailand and Vietnam continue to report double-digit growth in digital food-delivery transactions, elevating demand for leak-proof, temperature-retentive packs that survive motorcycle logistics. Jakarta operators now allocate 15-20% of order value to packaging, prompting suppliers to engineer stackable designs that cut spillage and enhance brand visibility. A widening base of single-person households favors smaller portions, spurring mini-tub and two-compartment formats. Delivery-platform standardization simplifies SKUs and aids scale economies, while local governments encourage post-use collection schemes that feed emerging recycling infrastructure. These converging forces lift volume yet accelerate the switch to mono-material laminates to ease downstream sorting.
EU Tethered-Cap Rule Accelerating Mono-Material PET Adoption
Europe's July 2024 tethered-cap mandate has driven rapid conversion of bottling lines; Coca-Cola alone invested EUR 150 million across 40 sites and achieved 95% consumer acceptance. Suppliers respond with tethered closures that mate seamlessly to virgin, recycled and bio-PET bottles, boosting capture rates and reinforcing PET's recycling advantage. California will follow by 2027, creating a de-facto global standard that favors producers able to retrofit at scale. Origin Materials' cross-compatible caps showcase how regulation spurs differentiated product features such as enhanced ergonomics and tamper evidence.
Easy Availability of Substitutes
Fiber-based lids, molded-pulp trays and bio-derived films erode demand where barrier rigor is moderate. McDonald's Taiwan removed plastic lamination from menus in 2025, saving 86 t of resin annually and preserving 10,000 trees. EU rules requiring recyclability by 2030 accelerate brand pilots of compostable meat trays containing 54% wood cellulose. Dry-molded fiber technology introduced by Dart Container in North America cuts energy use by 80%, improving cost competitiveness against legacy EPS. As tooling migrates, the single-use plastic packaging market faces intensified competition in low-temperature or short-life applications.
Other drivers and restraints analyzed in the detailed report include:
- RTD Functional Beverages Spurring Lightweight Barrier Pouches
- India's Pharma Blister Outsourcing Surge
- Crude-Linked Resin Price Volatility
For complete list of drivers and restraints, kindly check the Table Of Contents.
Segment Analysis
PET captured 34.68% of the single-use plastic packaging market share in 2025 and is expected to widen its lead at a 6.95% CAGR as bottle-to-bottle loops mature. Europe's 30% recycled-content order for beverage bottles underpins premium demand for rPET flake, prompting investments like Ganesha Ecopet's 42,000 t pa expansion to meet local brand quotas. Recyclability, barrier clarity and tethered-cap compatibility combine to cement PET's role in beverage and personal-care aisles.
Polyethylene and polypropylene remain workhorses in films, bags and closures thanks to versatility and cost, yet growth lags as regulators target harder-to-recycle multi-layer laminates. Polystyrene loses share in food service due to bans, while bio-based polymers gain niche traction where performance demands align with compostability mandates. Tech giants push chemical recycling pilots, but until scale and economics converge, PET retains its pragmatic superiority in the single-use plastic packaging market.
Bottles retain the largest revenue slice at 30.12% in 2025, benefiting from tethered-cap rollouts and on-the-go hydration trends. Even so, pouches and sachets outpace at 4.98% CAGR, driven by functional drinks, condiments and personal-wash refills. FDA-approved ultra-thin barrier films help brands shed 30% of pack weight while preserving shelf stability, making pouches the go-to for portion control and e-commerce.
Clamshells, trays and cups navigate mixed signals: retail produce favors rPET thermoforms, while quick-service eateries trial fiber bowls to satisfy local ordinances. Films and wraps enjoy e-grocery tailwinds but confront recyclability gaps, prompting consortium efforts to standardize mono-material PE structures. Across formats, design-for-recycling becomes a core selection criterion, steering capital toward solutions compatible with curbside collection in leading regions.
Complete Report Scope:
- By Material
- Polyethylene Terephthalate (PET)
- Polyethylene (PE)
- Polypropylene (PP)
- Polystyrene (PS)
- Other Materials
- By Product Type
- Bottles
- Pouches and Sachets
- Clamshells
- Trays, Cups and Lids
- Films and Wraps
- Other Product Types
- By End-Use Industfy
- Quick-Service Restaurants (QSR)
- Full-Service Restaurants (FSR)
- Food and Beverages
- Healthcare and Pharmaceutical
- Personal Care and Cosmetics
- Other End-Use Industry
- By Distribution Channel
- Direct Sales
- Indirect Sales
- By Geography
- North America
- United States
- Canada
- Mexico
- Europe
- Germany
- United Kingdom
- France
- Italy
- Spain
- Russia
- Rest of Europe
- Asia-Pacific
- China
- India
- Japan
- South Korea
- Australia and New Zealand
- Rest of Asia-Pacific
- Middle East and Africa
- Middle East
- United Arab Emirates
- Saudi Arabia
- Turkey
- Rest of Middle East
- Africa
- South Africa
- Nigeria
- Egypt
- Rest of Africa
- Middle East
- South America
- Brazil
- Argentina
- Rest of South America
- North America
Geography Analysis
Asia-Pacific's 39.85% slice of the single-use plastic packaging market reflects the region's manufacturing heft, urban population growth and expanding middle class. China's packaging sector generated RMB 2.3 trillion in output during 2024, supported by e-grocery and cold-chain investment waves that demand EPS and rPET solutions. India adds momentum through blister exports and food-delivery growth, while Southeast Asia posts 35% e-commerce transaction expansion that lifts protective mailer demand.
North America exhibits mature but dynamic conditions shaped by state-level bans and recycled-content quotas. California's extended producer responsibility law influences brand specifications nationwide, pushing 30% PCR PET targets ahead of federal guidelines. Investments in mechanical and chemical recycling proliferate; Amcor entered a multiyear mechanically-recycled PE deal to secure feedstock continuity.
Europe remains the regulatory vanguard, with the Single-Use Plastics Directive, PPWR and tethered-cap law steering global design templates. Compliance costs drive consolidation yet also catalyze innovation in mono-material flexible structures and molded-fiber keepsake lids.
The Middle East & Africa lead growth at 5.45% CAGR through 2031. Saudi Arabia's Vision 2030 tourism strategy lifted visitor arrivals 56% in 2024, fueling bottled-water packaging spikes; Masafi invested AED 120 million in capacity enhancements to serve hospitality contracts. Infrastructure mega-projects such as NEOM expand demand for protective and barrier materials able to withstand desert logistics stresses, incentivizing suppliers to site recycling hubs regionally.
Latin America delivers pockets of expansion, notably Brazil where packaging production rose 8% in 2024. Currency fluctuations and uneven regulation temper foreign investment, but local processors upgrade equipment to tap the single-use plastic packaging market opportunity in cross-border e-commerce.
- Amcor plc
- Novolex
- Huhtamaki Oyj
- Sealed Air Corp.
- Dart Container Corp.
- Graphic Packaging International LLC
- Winpak Ltd.
- Sonoco Products Co.
- Reynolds Consumer Products
- Sabert Corp.
- Genpak LLC
- Coveris Holdings
- Fabri-Kal
- Inteplast Group
- Hotpack Packaging Industries LLC
- Alpla Werke Alwin Lehner GmbH
- Plastipak Holdings
Additional Benefits:
- The market estimate (ME) sheet in Excel format
- 3 months of analyst support
TABLE OF CONTENTS
1 INTRODUCTION
- 1.1 Study Assumptions and Market Definition
- 1.2 Scope of the Study
2 RESEARCH METHODOLOGY
3 EXECUTIVE SUMMARY
4 MARKET LANDSCAPE
- 4.1 Market Overview
- 4.2 Market Drivers
- 4.2.1 App-based Food-Delivery Boom in Asian Megacities
- 4.2.2 EU Tethered-Cap Rule Accelerating Mono-Material PET Adoption
- 4.2.3 RTD Functional Beverages Spurring Lightweight Barrier Pouches in North America
- 4.2.4 India's Pharma Blister Outsourcing Surge
- 4.2.5 Tourism-Led Bottled-Water Demand Spike in GCC
- 4.2.6 Urban China Cold-Chain Expansion Driving EPS Trays
- 4.3 Market Restraints
- 4.3.1 Easy Availability of Substitutes
- 4.3.2 EU SUP Directive Pushing Brands to Fiber Substitutes
- 4.3.3 Crude-Linked Resin Price Volatility
- 4.3.4 US State-Level Bans on Cutlery and Straws
- 4.4 Supply-Chain Analysis
- 4.5 Regulatory Outlook
- 4.6 Technological Outlook
- 4.7 Porter's Five Forces Analysis
- 4.7.1 Bargaining Power of Suppliers
- 4.7.2 Bargaining Power of Buyers
- 4.7.3 Threat of New Entrants
- 4.7.4 Threat of Substitutes
- 4.7.5 Intensity of Competitive Rivalry
- 4.8 Investment Analysis
5 MARKET SIZE AND GROWTH FORECASTS
- 5.1 By Material
- 5.1.1 Polyethylene Terephthalate (PET)
- 5.1.2 Polyethylene (PE)
- 5.1.3 Polypropylene (PP)
- 5.1.4 Polystyrene (PS)
- 5.1.5 Other Materials
- 5.2 By Product Type
- 5.2.1 Bottles
- 5.2.2 Pouches and Sachets
- 5.2.3 Clamshells
- 5.2.4 Trays, Cups and Lids
- 5.2.5 Films and Wraps
- 5.2.6 Other Product Types
- 5.3 By End-Use Industfy
- 5.3.1 Quick-Service Restaurants (QSR)
- 5.3.2 Full-Service Restaurants (FSR)
- 5.3.3 Food and Beverages
- 5.3.4 Healthcare and Pharmaceutical
- 5.3.5 Personal Care and Cosmetics
- 5.3.6 Other End-Use Industry
- 5.4 By Distribution Channel
- 5.4.1 Direct Sales
- 5.4.2 Indirect Sales
- 5.5 By Geography
- 5.5.1 North America
- 5.5.1.1 United States
- 5.5.1.2 Canada
- 5.5.1.3 Mexico
- 5.5.2 Europe
- 5.5.2.1 Germany
- 5.5.2.2 United Kingdom
- 5.5.2.3 France
- 5.5.2.4 Italy
- 5.5.2.5 Spain
- 5.5.2.6 Russia
- 5.5.2.7 Rest of Europe
- 5.5.3 Asia-Pacific
- 5.5.3.1 China
- 5.5.3.2 India
- 5.5.3.3 Japan
- 5.5.3.4 South Korea
- 5.5.3.5 Australia and New Zealand
- 5.5.3.6 Rest of Asia-Pacific
- 5.5.4 Middle East and Africa
- 5.5.4.1 Middle East
- 5.5.4.1.1 United Arab Emirates
- 5.5.4.1.2 Saudi Arabia
- 5.5.4.1.3 Turkey
- 5.5.4.1.4 Rest of Middle East
- 5.5.4.2 Africa
- 5.5.4.2.1 South Africa
- 5.5.4.2.2 Nigeria
- 5.5.4.2.3 Egypt
- 5.5.4.2.4 Rest of Africa
- 5.5.4.1 Middle East
- 5.5.5 South America
- 5.5.5.1 Brazil
- 5.5.5.2 Argentina
- 5.5.5.3 Rest of South America
- 5.5.1 North America
6 COMPETITIVE LANDSCAPE
- 6.1 Market Concentration
- 6.2 Strategic Moves
- 6.3 Market Share Analysis
- 6.4 Company Profiles (includes Global level Overview, Market level overview, Core Segments, Financials as available, Strategic Information, Market Rank/Share for key companies, Products and Services, and Recent Developments)
- 6.4.1 Amcor plc
- 6.4.2 Novolex
- 6.4.3 Huhtamaki Oyj
- 6.4.4 Sealed Air Corp.
- 6.4.5 Dart Container Corp.
- 6.4.6 Graphic Packaging International LLC
- 6.4.7 Winpak Ltd.
- 6.4.8 Sonoco Products Co.
- 6.4.9 Reynolds Consumer Products
- 6.4.10 Sabert Corp.
- 6.4.11 Genpak LLC
- 6.4.12 Coveris Holdings
- 6.4.13 Fabri-Kal
- 6.4.14 Inteplast Group
- 6.4.15 Hotpack Packaging Industries LLC
- 6.4.16 Alpla Werke Alwin Lehner GmbH
- 6.4.17 Plastipak Holdings
7 MARKET OPPORTUNITIES AND FUTURE OUTLOOK
- 7.1 White-Space and Unmet-Need Assessment

