
Need help finding what you are looking for?
Contact Us
PUBLISHER: Mordor Intelligence | PRODUCT CODE: 1693528

PUBLISHER: Mordor Intelligence | PRODUCT CODE: 1693528
North America Micronutrient Fertilizer - Market Share Analysis, Industry Trends & Statistics, Growth Forecasts (2025 - 2030)
PUBLISHED:
PAGES: 196 Pages
DELIVERY TIME: 2-3 business days
SELECT AN OPTION
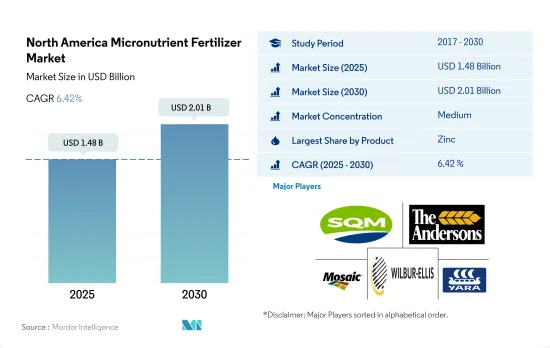
The North America Micronutrient Fertilizer Market size is estimated at 1.48 billion USD in 2025, and is expected to reach 2.01 billion USD by 2030, growing at a CAGR of 6.42% during the forecast period (2025-2030).
Expansion of cultivation and the need for micronutrients to enhance quality and yield are anticipated to drive the demand for micronutrients
- Micronutrients are essential for plant growth. They play an important role in balanced crop nutrition. The lack of any of the micronutrients may limit plant growth. Micronutrient fertilizers contain elements like boron, copper, manganese, zinc, and cobalt. Plants require these substances in small quantities.
- By crop type, field crops recorded the highest value of USD 1.26 billion and a consumption volume of 399.2 thousand metric tons in 2022. Field crops accounted for about 88.7% of agricultural land in North America during the same period.
- The conventional micronutrient fertilizers segment accounted for 79.0% of the market share and was valued at USD 1.12 billion in 2022. It is anticipated to reach USD 1.57 billion by 2030. The specialty fertilizers segment accounted for 21.0% and was valued at USD 298.7 million in 2022. It is expected to reach USD 435.1 million by the end of 2030.
- In 2022, zinc accounted for 27.0% of the total micronutrient fertilizer market in North America and is the largest valued micronutrient. Zinc is a major component of plant enzyme systems. Zinc aids in the activation of various types of enzymes, boosting carbohydrate metabolism. Zinc deficiency is particularly common in Washington orchards, maize, and wheat, and it primarily causes stunted growth and little leaf disorder.
- Copper accounted for 17.3% of the North American micronutrient fertilizers market in 2022. Copper deficiency is becoming more widespread across Western Canada, limiting the growth of the crop and reducing yield potential because the natural stores of copper have been depleted by plants that take up copper in higher amounts. The copper fertilizer market is anticipated to witness a CAGR of 5.3% during 2023-2030.
The need to improve soil fertility and nutrient deficiency will fuel the growth of the market
- With nearly 98.8 million hectares of agricultural land, the United States dominates as North America's top agriculture producer. In 2022, the US commanded a significant 56.9% share of the North American market for micronutrient fertilizers.
- In 2022, crop cultivation in the US covered 139.7 million hectares, a 1% increase from the previous year. This expansion in cultivated areas has coincided with a growing reliance on micronutrient fertilizers, driven by escalating soil nutrient deficiencies.
- Canada, the second-largest agricultural landowner in North America, boasted around 30.9 million hectares. In 2022, Canada held a 14.2% share of the region's micronutrient fertilizer market. Over 88.0% of Canada's agricultural land is dedicated to crops, with notable concentrations in the Prairies, Quebec, and Southern Ontario.
- In 2022, Mexico emerged as a significant player in the micronutrient fertilizer market, capturing a 26.6% share in market value and 26.4% in volume. Field crops dominated Mexico's micronutrient fertilizer market, accounting for 88.3% of the total volume. Horticulture crops followed at 7.0%, with turf & ornamental crops making up the remaining 4.7%. Key field crops in Mexico include corn, sugarcane, and wheat.
- Other North American countries collectively contributed 2.4% to the total micronutrient fertilizer market value in 2022. Nations like the Dominican Republic, El Salvador, and Nicaragua, in this segment, rely on fertilizer imports and heavily depend on imported agricultural commodities.
- The North American micronutrient fertilizer market is on a steady growth trajectory and is projected to continue expanding in the coming years. This growth is driven by the increasing recognition of micronutrients' pivotal role in ensuring robust crop growth.
North America Micronutrient Fertilizer Market Trends
Government support, such as subsidies, contributed to the expansion of field crops
- A wide array of crops are grown on North American farms, mainly covering field crops. Corn, cotton, rice, soybean, and wheat are some of the dominating field crops across the region. The United States, Canada, and Mexico are major contributors to the region's agricultural output. In 2022, field crops covered around 97.6% of the overall cultivation in North America, with cereals and oilseeds dominating the market.
- By country, the United States dominates the market by covering 135.7 million hectares of the overall area under crop cultivation. Among them, field crops and horticulture cover the majority of the area and accounted for 97.2% and 2.8% in the year 2022. However, between 2018-2019, the country witnessed a significant dip in crop acreages, which was mainly due to unfavorable environmental conditions resulting in heavy floods in areas like Texas and Houston.
- The largest crop cultivated is corn, the majority of which is grown in a region known as the 'Corn Belt'-a traditional area in the Midwestern United States, roughly covering western Indiana, Illinois, Iowa, Missouri, eastern Nebraska, and eastern Kansas, where corn (maize) and soybeans are the dominant crops. The United States is also a major rice exporter. The rice cultivation in the region is mainly concentrated within four regions, with three in the South and one in California. Therefore, the increased market potential for the region's field crop, coupled with increased government funding and protection, is anticipated to positively drive the area under field crop cultivation in the region.
Raising micronutrient deficiencies and crop losses increase micronutrient application rates
- In 2022, the highest application rates were observed for manganese, copper, zinc, iron, and boron, at 10.6 kg/ha, 6.9 kg/ha, 6.8 kg/ha, 3.3 kg/ha, and 1.5 kg/ha, respectively. Although most micronutrients have lower crop uptake, their unavailability can severely limit critical plant functions, leading to abnormalities, stunted growth, and reduced yields. Given the rising yields, commodity prices, and input costs, growers are scrutinizing potential barriers to grain production, including micronutrient deficiencies.
- Wheat, sorghum, soybean, and cotton dominate micronutrient fertilizer consumption, with other field crops like corn and rice playing a smaller role. Wheat, in particular, faces significant deficiencies in copper and manganese, while iron and zinc deficiencies also mildly impact its yield.
- The micronutrient requirements of each crop are influenced by regional soil conditions. In the United States, sandy soils in the southeast, which are low in organic matter and prone to leaching, commonly exhibit boron deficiencies, unlike the fertile black soils in the northeast. Similarly, certain fields in Central Alberta, Canada, face copper deficiencies, which are crucial for cereal cultivation.
- All agricultural soils in Mexico are zinc-deficient. However, this condition is more common in Queretaro, Sonora, and Sinaloa, indicating an increased need for zinc micronutrient fertilizers. North American soil is naturally deficient in micronutrients, leading to increased consumption of micronutrient supplements during cultivation.
North America Micronutrient Fertilizer Industry Overview
The North America Micronutrient Fertilizer Market is moderately consolidated, with the top five companies occupying 63.51%. The major players in this market are Sociedad Quimica y Minera de Chile SA, The Andersons Inc., The Mosaic Company, Wilbur-Ellis Company LLC and Yara International ASA (sorted alphabetically).
Additional Benefits:
- The market estimate (ME) sheet in Excel format
- 3 months of analyst support
Product Code: 92592
TABLE OF CONTENTS
1 EXECUTIVE SUMMARY & KEY FINDINGS
2 REPORT OFFERS
3 INTRODUCTION
- 3.1 Study Assumptions & Market Definition
- 3.2 Scope of the Study
- 3.3 Research Methodology
4 KEY INDUSTRY TRENDS
- 4.1 Acreage Of Major Crop Types
- 4.1.1 Field Crops
- 4.1.2 Horticultural Crops
- 4.2 Average Nutrient Application Rates
- 4.2.1 Micronutrients
- 4.2.1.1 Field Crops
- 4.2.1.2 Horticultural Crops
- 4.2.1 Micronutrients
- 4.3 Agricultural Land Equipped For Irrigation
- 4.4 Regulatory Framework
- 4.5 Value Chain & Distribution Channel Analysis
5 MARKET SEGMENTATION (includes market size in Value in USD and Volume, Forecasts up to 2030 and analysis of growth prospects)
- 5.1 Product
- 5.1.1 Boron
- 5.1.2 Copper
- 5.1.3 Iron
- 5.1.4 Manganese
- 5.1.5 Molybdenum
- 5.1.6 Zinc
- 5.1.7 Others
- 5.2 Application Mode
- 5.2.1 Fertigation
- 5.2.2 Foliar
- 5.2.3 Soil
- 5.3 Crop Type
- 5.3.1 Field Crops
- 5.3.2 Horticultural Crops
- 5.3.3 Turf & Ornamental
- 5.4 Country
- 5.4.1 Canada
- 5.4.2 Mexico
- 5.4.3 United States
- 5.4.4 Rest of North America
6 COMPETITIVE LANDSCAPE
- 6.1 Key Strategic Moves
- 6.2 Market Share Analysis
- 6.3 Company Landscape
- 6.4 Company Profiles
- 6.4.1 Haifa Group
- 6.4.2 Koch Industries Inc.
- 6.4.3 Nouryon
- 6.4.4 Sociedad Quimica y Minera de Chile SA
- 6.4.5 The Andersons Inc.
- 6.4.6 The Mosaic Company
- 6.4.7 Wilbur-Ellis Company LLC
- 6.4.8 Yara International ASA
7 KEY STRATEGIC QUESTIONS FOR FERTILIZER CEOS
8 APPENDIX
- 8.1 Global Overview
- 8.1.1 Overview
- 8.1.2 Porter's Five Forces Framework
- 8.1.3 Global Value Chain Analysis
- 8.1.4 Market Dynamics (DROs)
- 8.2 Sources & References
- 8.3 List of Tables & Figures
- 8.4 Primary Insights
- 8.5 Data Pack
- 8.6 Glossary of Terms
Have a question?


SELECT AN OPTION
Have a question?
Questions? Please give us a call or visit the contact form.