
PUBLISHER: Mordor Intelligence | PRODUCT CODE: 1850003

PUBLISHER: Mordor Intelligence | PRODUCT CODE: 1850003
Workspace As A Service (WaaS) - Market Share Analysis, Industry Trends & Statistics, Growth Forecasts (2025 - 2030)
The Workspace As A Service (WaaS) Market size reached USD 10.02 billion in 2025 and is projected to climb to USD 17.67 billion by 2030, reflecting a steady 12% CAGR over the forecast period.
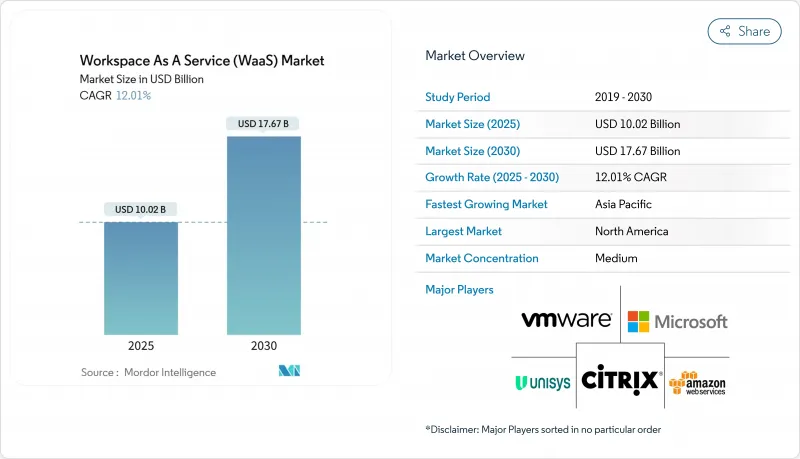
Growth is underpinned by enterprises shifting to cloud-first digital workplace architectures that converge security, compliance, and productivity tools into a single virtual experience. Hyperscaler capital spending exceeding USD 380 billion has unlocked global GPU capacity that supports AI-driven virtual desktops, while pay-as-you-go pricing keeps barriers low for small teams in every sector. Rapid adoption of zero-trust frameworks, rising compliance scrutiny, and secure hybrid-work requirements sustain demand across regulated verticals. Meanwhile, moderate market concentration encourages both incumbents and emerging cloud-native vendors to innovate around specialized workloads such as graphics design, financial trading, and real-time collaboration.
Global Workspace As A Service (WaaS) Market Trends and Insights
BYOD Proliferation Boosts WaaS Demand
Organizations adopting Bring Your Own Device policies increasingly rely on centralized virtual desktops to protect data and enforce uniform security. Multi-factor authentication, granular conditional access, and session isolation embedded in WaaS reduce risks tied to unmanaged hardware. Accounting, legal, and design firms report faster onboarding of seasonal staff because virtual apps are delivered instantly to personal laptops and tablets. CIOs also cite improved IT asset visibility, since device-agnostic delivery keeps intellectual property inside the datacenter rather than on endpoints. This momentum positions BYOD as a mid-term driver across mature and emerging markets.
Cloud-VDI Cost and Scalability Advantages
Cloud-hosted virtual desktops lower total cost of ownership by removing bulk hardware refreshes and shifting expenditure to consumption-based models. Amazon WorkSpaces Thin Client devices start at USD 195 and stream encrypted pixels from the cloud, illustrating how central management reduces desk-side support. Microsoft Azure Virtual Desktop adds multi-session Windows 11 to maximize density, while global datacenter footprints enable instant scaling during mergers or peak project phases. These efficiencies resonate most strongly with Asia-Pacific SMEs that previously lacked capital for enterprise-grade infrastructure.
Persistent Network Latency and Bandwidth Gaps
Virtual desktops are highly sensitive to round-trip delay. Citrix benchmark testing shows user experience falls sharply once latency breaches 150 milliseconds and becomes unacceptable beyond 300 milliseconds. Many rural districts and emerging economies still rely on inconsistent broadband, leading to input lag, audio dropouts, and blurred graphics that discourage adoption. Hyperscalers mitigate constraints through nearby edge zones and adaptive UDP transport, yet last-mile infrastructure remains uneven. Government-sponsored fiber rollouts and 5G fixed-wireless pilots will be pivotal, especially for deployments involving high-definition video or CAD workloads.
Other drivers and restraints analyzed in the detailed report include:
- Hybrid-Work Security Requirements
- Hyperscaler DaaS Portfolio Expansion
- Legacy-App Integration Complexity
For complete list of drivers and restraints, kindly check the Table Of Contents.
Segment Analysis
Desktop as a Service secured 56.7% share of the Workspace as a Service market in 2024, reflecting persistent demand for full operating-system images that support legacy line-of-business software. Enterprises favor the model because centralized patching, golden-image management, and instant rollback simplify compliance compared with individual laptops. DaaS adoption also scales smoothly for contractors and seasonal staff thanks to hourly billing. The segment's leadership has prompted platform vendors to merge complementary functions such as identity, observability, and endpoint analytics into unified consoles.
Integrated Collaboration Suites represent the fastest-rising category at 13.1% CAGR through 2030. Bundles combining chat, calling, document co-authoring, and workflow automation reduce tool sprawl and encourage license consolidation. Microsoft Teams inside existing Office 365 agreements and Google Workspace in education and startup cohorts dominate volumes. Vendors now embed meeting-transcription AI, whiteboarding, and low-code process builders, positioning suites as a launchpad for broader digital experience platforms. This trajectory will gradually dilute standalone conferencing or storage solutions as firms gravitate toward cohesive ecosystems.
On-premise deployments controlled 67.5% of the Workspace as a Service market size in 2024 as enterprises leveraged sunk investments and asserted data sovereignty. Such estates often pair VDI software with hyperconverged clusters running in private datacenters. However, stringent capacity planning, hardware refresh cycles, and separate disaster-recovery sites keep capital costs high.
Cloud deployment is set to register the strongest 13.8% CAGR to 2030. Providers deliver enterprise-grade GPUs, automated elasticity, and global redundancy without upfront spend. Microsoft's Azure Virtual Desktop on Azure Stack HCI bridges both worlds by hosting virtual session hosts on-premise while controlling them from the cloud. European organizations gravitate toward sovereign cloud regions that address GDPR and Schrems II data transfer rulings. Over time, the public-cloud operating model will dominate new greenfield deployments and workload expansion even among highly regulated entities.
The Workspace As A Service (WaaS) Market Report is Segmented by Solution (Desktop As A Service (DaaS), Application As A Service (AaaS), and More), Deployment Model (On-Premise and Cloud), Organization Size (Large Enterprises and Small and Medium Enterprises (SMEs)), End-User Vertical (BFSI, Education, Retail and E-Commerce, and More) and Geography. The Market Forecasts are Provided in Terms of Value (USD).
Geography Analysis
North America retained leadership with 35.6% share of the Workspace as a Service market in 2024, supported by mature cloud infrastructure, high broadband penetration, and early adoption across technology, finance, and media. Regulatory clarity around remote work data controls accelerated rollouts, while hyperscaler density in multiple metropolitan zones kept latency within optimal thresholds. Ongoing private-sector investments in AI-optimized datacenters, including Amazon's USD 10 billion North Carolina campus, continue to reinforce the regional supply base.
Asia-Pacific is projected to record the fastest 12.7% CAGR to 2030. Governments in India, Indonesia, and Vietnam earmark grants and spectrum incentives to extend fiber and 5G coverage, enabling SMEs and public agencies to leapfrog on-premise IT in favor of cloud desktops. Amazon's AU$20 billion allocation for Australian datacenters paired with new solar farms underscores regional appetite for green infrastructure. Domestic cloud providers in Japan and South Korea are also launching GPU-rich clusters to support language-model development and 3D design, fueling demand for high-performance workstations served from nearby zones.
Europe remains a growth pivot anchored on sovereign cloud frameworks. The European Data Act and sector-specific mandates force workloads to stay inside regional boundaries, prompting France, Germany, and the Nordics to adopt trusted cloud partner networks. VMware's sovereign-cloud reference architecture offers standardized compliance templates that expedite virtual desktop certification. As firms renew hardware cycles, many downsize on-premise racks and subscribe to sanctioned public-cloud regions, blending performance with legal assurance. The Middle East and Africa register nascent uptake tied to economic diversification programs, while Latin America sees steady momentum where fiber backbones and edge nodes close historic bandwidth gaps.
- Amazon Web Services Inc.
- VMware Inc.
- Citrix Systems Inc.
- Microsoft Corporation
- Google LLC
- IBM Corporation
- Cisco Systems Inc.
- Accenture plc
- DXC Technology Co.
- Hewlett Packard Enterprise
- Nutanix Inc.
- Workspot Inc.
- Cloudalize NV
- Dizzion Inc.
- Getronics NV
- Unisys Corporation
- NTT DATA Corporation
- Colt Technology Services
- Oracle Corporation
- Huawei Technologies Co. Ltd.
Additional Benefits:
- The market estimate (ME) sheet in Excel format
- 3 months of analyst support
TABLE OF CONTENTS
1 INTRODUCTION
- 1.1 Study Assumptions and Market Definition
- 1.2 Scope of the Study
2 RESEARCH METHODOLOGY
3 EXECUTIVE SUMMARY
4 MARKET LANDSCAPE
- 4.1 Market Overview
- 4.2 Market Drivers
- 4.2.1 BYOD proliferation boosts WaaS demand
- 4.2.2 Cloud-VDI cost and scalability advantages
- 4.2.3 Hybrid-work security requirements
- 4.2.4 Hyperscaler DaaS portfolio expansion
- 4.2.5 ESG dashboards embedded in digital workplace
- 4.2.6 GPU-accelerated virtual workstations (AI/graphics)
- 4.3 Market Restraints
- 4.3.1 Persistent network latency and bandwidth gaps
- 4.3.2 Legacy-app integration complexity
- 4.3.3 Rising cloud egress fees erode TCO
- 4.3.4 Data-sovereignty rules force local VDI footprint
- 4.4 Value Chain Analysis
- 4.5 Regulatory Landscape
- 4.6 Technological Outlook
- 4.7 Porter's Five Forces Analysis
- 4.7.1 Bargaining Power of Suppliers
- 4.7.2 Bargaining Power of Buyers
- 4.7.3 Threat of New Entrants
- 4.7.4 Threat of Substitutes
- 4.7.5 Intensity of Competitive Rivalry
- 4.8 Assessment of the Impact of Macroeconomic Trends on the Market
5 MARKET SIZE AND GROWTH FORECASTS (VALUE)
- 5.1 By Solution
- 5.1.1 Desktop as a Service (DaaS)
- 5.1.2 Application as a Service (AaaS)
- 5.1.3 Managed Security and Compliance-aaS
- 5.1.4 Integrated Collaboration Suites
- 5.2 By Deployment Model
- 5.2.1 On-Premise
- 5.2.2 Cloud
- 5.3 By Organization Size
- 5.3.1 Large Enterprises
- 5.3.2 Small and Medium Enterprises (SMEs)
- 5.4 By End-user Vertical
- 5.4.1 BFSI
- 5.4.2 Education
- 5.4.3 Retail and e-Commerce
- 5.4.4 Government and Public Sector
- 5.4.5 IT and Telecom
- 5.4.6 Other End-user Verticals
- 5.5 By Geography
- 5.5.1 North America
- 5.5.1.1 United States
- 5.5.1.2 Canada
- 5.5.1.3 Mexico
- 5.5.2 Europe
- 5.5.2.1 Germany
- 5.5.2.2 United Kingdom
- 5.5.2.3 France
- 5.5.2.4 Italy
- 5.5.2.5 Spain
- 5.5.2.6 Rest of Europe
- 5.5.3 Asia-Pacific
- 5.5.3.1 China
- 5.5.3.2 Japan
- 5.5.3.3 India
- 5.5.3.4 South Korea
- 5.5.3.5 Australia
- 5.5.3.6 Rest of Asia-Pacific
- 5.5.4 South America
- 5.5.4.1 Brazil
- 5.5.4.2 Argentina
- 5.5.4.3 Rest of South America
- 5.5.5 Middle East and Africa
- 5.5.5.1 Middle East
- 5.5.5.1.1 Saudi Arabia
- 5.5.5.1.2 United Arab Emirates
- 5.5.5.1.3 Turkey
- 5.5.5.1.4 Rest of Middle East
- 5.5.5.2 Africa
- 5.5.5.2.1 South Africa
- 5.5.5.2.2 Egypt
- 5.5.5.2.3 Nigeria
- 5.5.5.2.4 Rest of Africa
- 5.5.1 North America
6 COMPETITIVE LANDSCAPE
- 6.1 Market Concentration
- 6.2 Strategic Moves
- 6.3 Market Share Analysis
- 6.4 Company Profiles (includes Global level Overview, Market level overview, Core Segments, Financials as available, Strategic Information, Market Rank/Share, Products and Services, Recent Developments)
- 6.4.1 Amazon Web Services Inc.
- 6.4.2 VMware Inc.
- 6.4.3 Citrix Systems Inc.
- 6.4.4 Microsoft Corporation
- 6.4.5 Google LLC
- 6.4.6 IBM Corporation
- 6.4.7 Cisco Systems Inc.
- 6.4.8 Accenture plc
- 6.4.9 DXC Technology Co.
- 6.4.10 Hewlett Packard Enterprise
- 6.4.11 Nutanix Inc.
- 6.4.12 Workspot Inc.
- 6.4.13 Cloudalize NV
- 6.4.14 Dizzion Inc.
- 6.4.15 Getronics NV
- 6.4.16 Unisys Corporation
- 6.4.17 NTT DATA Corporation
- 6.4.18 Colt Technology Services
- 6.4.19 Oracle Corporation
- 6.4.20 Huawei Technologies Co. Ltd.
7 MARKET OPPORTUNITIES AND FUTURE OUTLOOK
- 7.1 White-space and Unmet-Need Assessment

