
Need help finding what you are looking for?
Contact Us
PUBLISHER: Mordor Intelligence | PRODUCT CODE: 1683495

PUBLISHER: Mordor Intelligence | PRODUCT CODE: 1683495
United States Plant Protein - Market Share Analysis, Industry Trends & Statistics, Growth Forecasts (2025 - 2030)
PUBLISHED:
PAGES: 260 Pages
DELIVERY TIME: 2-3 business days
SELECT AN OPTION
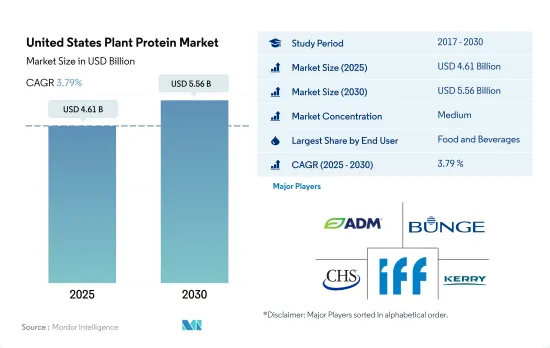
The United States Plant Protein Market size is estimated at 4.61 billion USD in 2025, and is expected to reach 5.56 billion USD by 2030, growing at a CAGR of 3.79% during the forecast period (2025-2030).
F&B and Animal feed together accounted for more than 50% of share in 2022, due to rising veganism coupled with growing preference for plant-based foods as a sustainable alternative.
- The food and beverage segment witnessed the highest demand, followed by animal feed, in 2022. The food and beverages segment grew, registering a CAGR of 4.11% by value during the study period. The rising utilization of plant proteins in animal feed and cosmetics has driven growth in recent years. The high usage of protein types in feed composition, such as soy, wheat, and pea drives the animal feed market. The increase in demand for plant proteins in dairy and meat alternatives will drive the segment during the forecast period.
- The food and beverages sector applications drive the demand for plant proteins in the country, and they registered a volume share of 54.2% in 2022. This was majorly due to the increasing preference for plant-based foods as a sustainable alternative. The meat alternative products sub-segment is witnessing huge demand from food and beverages applications, with a share of 38.03% by volume in 2022, followed by the dairy alternative products sub-segment. The rapid expansion of plant-based meats, which are now widely available in grocery stores and offered in fast-food restaurants, makes these diets more convenient and easier to maintain.
- Supplements are anticipated to be the fastest-growing sector in the market, registering a CAGR of 6.30% during the forecast period, owing to their immense health benefits. Plant protein powder is rich in fiber and is more nutrient dense than dairy protein powder, making it a suitable alternative to casein and whey powder. Plant proteins, such as rice and peas, are gaining popularity for being hypoallergenic and a nutritious alternative for people suffering from lactose intolerance. In 2022, 36% of the US population was lactose-intolerant people, leading to high demand for alternative proteins.
United States Plant Protein Market Trends
Growth in plant protein consumption provides opportunities for key players in the ingredients market
- The per capita consumption rate of plant proteins is increasing at a considerable rate in the United States, supported by investments and innovations, resulting in a consumption rate of 40.28 grams per day, primarily due to a rising number of consumers turning vegan to promote animal welfare. This is because factory farming, where animals are maltreated, is a norm in the United States. Most Americans eat less meat and animal products, but they do not eliminate their consumption entirely. They also tend to be more flexitarian than vegan or vegetarian. Nearly 12% of consumers in the country prefer a plant-based diet, whereas 7% of consumers follow a flexitarian diet. Although consumers of all generations in the United States are interested in plant-based meals, individuals in their 20s and 30s are the keenest to adopt plant-based diets.
- There is a constant rise in the per capita consumption of pea protein due to its wide applications in different food products, like meat, poultry, and bakery products. Around 41% of consumers are interested in plant-based food derived from pea protein. Pea protein is mainly used in sports nutrition and meat alternatives. A typical serving of pea protein powder is 30 grams, with 25 grams of protein. Athletes usually use one serving per day but may take as many as three servings per day.
- Soy and whey proteins are used primarily in the food and beverage, supplement, and sports nutrition industries. In 2021, around 36% of consumers were familiar with soy protein and had consumed the same, whereas 31% of individuals consumed whey protein in the US. Similarly, the consumption of soy-based food and beverages favorably increased by 12.9% during 2014-2019, and it is likely to remain consistent throughout the forecast period.
Soy, wheat, and pea production contributes majorly as raw material for plant protein ingredients manufacturers
- The graph given depicts the production data for raw materials such as dry peas, rice, wheat, and soya beans. There is an increasing scope for plant protein ingredients in the country due to the production recorded during the review period. The United States produces about one-third of the total soybeans in the world, followed closely by Brazil and Argentina. In 2021, the country produced 119.88 million MT of soybeans and accounted for 31% of the global soybean production. Wheat ranks third among the US field crops in planted acreage, production, and gross farm receipts behind corn and soybeans. In the marketing year 2023/24, the US farmers produced a total of 1.8 billion bushels of winter, durum, and other spring wheat from a harvested area of 37.3 million acres. Winter wheat production represents nearly 70% of total US production, on average.
- Hard red spring (HRS) wheat is one of the major wheat categories, accounting for almost 20% of the production. It is grown primarily in the northern plains, like North Dakota, Montana, Minnesota, and South Dakota. Hard red spring wheat is valued for its high protein level, making it suitable for specialty bread and blending with lower-protein wheat. Major restraints for the wheat protein market are the rising interest in gluten-free foods and the revived interest in low-carbohydrate diets. These may reduce the level of wheat consumption.
- Arkansas Grand Prairie, Mississippi Delta, Gulf Coast, and Sacramento Valley of California are four regions producing almost the entire US rice crop. Each of these regions normally specializes in a specific type of rice, referred to in the United States by length of grain, i.e., long, medium, and short. In general, long-grain production accounts for approximately 75% of the US rice production.
United States Plant Protein Industry Overview
The United States Plant Protein Market is moderately consolidated, with the top five companies occupying 52.48%. The major players in this market are Archer Daniels Midland Company, Bunge Limited, CHS Inc., International Flavors & Fragrances, Inc. and Kerry Group PLC (sorted alphabetically).
Additional Benefits:
- The market estimate (ME) sheet in Excel format
- 3 months of analyst support
Product Code: 90070
TABLE OF CONTENTS
1 EXECUTIVE SUMMARY & KEY FINDINGS
2 INTRODUCTION
- 2.1 Study Assumptions & Market Definition
- 2.2 Scope of the Study
- 2.3 Research Methodology
3 KEY INDUSTRY TRENDS
- 3.1 End User Market Volume
- 3.1.1 Baby Food and Infant Formula
- 3.1.2 Bakery
- 3.1.3 Beverages
- 3.1.4 Breakfast Cereals
- 3.1.5 Condiments/Sauces
- 3.1.6 Confectionery
- 3.1.7 Dairy and Dairy Alternative Products
- 3.1.8 Elderly Nutrition and Medical Nutrition
- 3.1.9 Meat/Poultry/Seafood and Meat Alternative Products
- 3.1.10 RTE/RTC Food Products
- 3.1.11 Snacks
- 3.1.12 Sport/Performance Nutrition
- 3.1.13 Animal Feed
- 3.1.14 Personal Care and Cosmetics
- 3.2 Protein Consumption Trends
- 3.2.1 Plant
- 3.3 Production Trends
- 3.3.1 Plant
- 3.4 Regulatory Framework
- 3.4.1 United States
- 3.5 Value Chain & Distribution Channel Analysis
4 MARKET SEGMENTATION (includes market size in Value in USD and Volume, Forecasts up to 2030 and analysis of growth prospects)
- 4.1 Protein Type
- 4.1.1 Hemp Protein
- 4.1.2 Pea Protein
- 4.1.3 Potato Protein
- 4.1.4 Rice Protein
- 4.1.5 Soy Protein
- 4.1.6 Wheat Protein
- 4.1.7 Other Plant Protein
- 4.2 End User
- 4.2.1 Animal Feed
- 4.2.2 Food and Beverages
- 4.2.2.1 By Sub End User
- 4.2.2.1.1 Bakery
- 4.2.2.1.2 Beverages
- 4.2.2.1.3 Breakfast Cereals
- 4.2.2.1.4 Condiments/Sauces
- 4.2.2.1.5 Confectionery
- 4.2.2.1.6 Dairy and Dairy Alternative Products
- 4.2.2.1.7 Meat/Poultry/Seafood and Meat Alternative Products
- 4.2.2.1.8 RTE/RTC Food Products
- 4.2.2.1.9 Snacks
- 4.2.3 Personal Care and Cosmetics
- 4.2.4 Supplements
- 4.2.4.1 By Sub End User
- 4.2.4.1.1 Baby Food and Infant Formula
- 4.2.4.1.2 Elderly Nutrition and Medical Nutrition
- 4.2.4.1.3 Sport/Performance Nutrition
5 COMPETITIVE LANDSCAPE
- 5.1 Key Strategic Moves
- 5.2 Market Share Analysis
- 5.3 Company Landscape
- 5.4 Company Profiles (includes Global Level Overview, Market Level Overview, Core Business Segments, Financials, Headcount, Key Information, Market Rank, Market Share, Products and Services, and Analysis of Recent Developments).
- 5.4.1 AGT Food and Ingredients Inc.
- 5.4.2 AMCO Proteins
- 5.4.3 Anchor Ingredients Co. LLC
- 5.4.4 Archer Daniels Midland Company
- 5.4.5 Axiom Foods Inc.
- 5.4.6 Bunge Limited
- 5.4.7 Cargill Incorporated
- 5.4.8 CHS Inc.
- 5.4.9 Farbest-Tallman Foods Corporation
- 5.4.10 Foodchem International Corporation
- 5.4.11 Glanbia PLC
- 5.4.12 Ingredion Incorporated
- 5.4.13 International Flavors & Fragrances, Inc.
- 5.4.14 Kerry Group PLC
- 5.4.15 MB-Holding GmbH & Co. KG
- 5.4.16 MGP
- 5.4.17 Roquette Freres
- 5.4.18 Sudzucker Group
- 5.4.19 The Scoular Company
6 KEY STRATEGIC QUESTIONS FOR PROTEIN INGREDIENTS INDUSTRY CEOS
7 APPENDIX
- 7.1 Global Overview
- 7.1.1 Overview
- 7.1.2 Porter's Five Forces Framework
- 7.1.3 Global Value Chain Analysis
- 7.1.4 Market Dynamics (DROs)
- 7.2 Sources & References
- 7.3 List of Tables & Figures
- 7.4 Primary Insights
- 7.5 Data Pack
- 7.6 Glossary of Terms
Have a question?


SELECT AN OPTION
Have a question?
Questions? Please give us a call or visit the contact form.