
Need help finding what you are looking for?
Contact Us
PUBLISHER: Mordor Intelligence | PRODUCT CODE: 1683509

PUBLISHER: Mordor Intelligence | PRODUCT CODE: 1683509
Rice Protein - Market Share Analysis, Industry Trends & Statistics, Growth Forecasts (2025 - 2030)
PUBLISHED:
PAGES: 357 Pages
DELIVERY TIME: 2-3 business days
SELECT AN OPTION
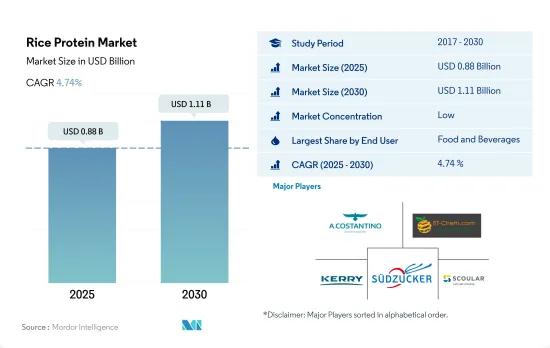
The Rice Protein Market size is estimated at 0.88 billion USD in 2025, and is expected to reach 1.11 billion USD by 2030, growing at a CAGR of 4.74% during the forecast period (2025-2030).
Growing lactose-intolerant population, globally and increasing protein consumption need is driving the use of rice protein
- Food and beverages remained the largest consumer of rice protein, among other end-user segments. The share was majorly influenced by meat and meat alternatives, which accounted for 82.82% of the rice protein volume consumed in 2022. Rice protein, mainly in the isolates form, has the ability to match meat protein content, which is driving its demand in the segment. Rice protein meets a variety of customer demands, including vegan, gluten-free, and high-protein food products. Rice proteins were used as meat extenders at various concentrations (3%, 6%, 9%, and 12%) in creating chicken nuggets, sausages, patties, and various other products.
- The sports and performance nutrition sub-segment drove the segment in the studied period and is projected to register the fastest CAGR of 5.99% during the forecast period. In 2021, the total market size of the global fitness club industry was over USD 87 billion. There are over 200,000 health and fitness clubs around the world. Rice proteins help strengthen the body's metabolism and regulate sugar levels. It helps to maintain the fitness of the body as rice proteins help to burn fats and improves the hydration of the skin cell.
- People with lactose intolerance are becoming more familiar with the component because it is hypoallergenic and a nutritional substitute. In 2021, the number of lactose-intolerant people in the world was around 68%, which led to high demand for alternative proteins, including rice protein. Since polished rice protein has an 86-90% human digestion rate, rice-based formulas have been used as a better soy milk substitute for kids with cow's milk allergies.
With increasing demand for protein supplements and intolerance to animal proteins, North America witnessed a growth in the market for rice protein in recent years
- Asia-Pacific is the leading market for rice protein globally due to its large consumer base and huge production volume. China, India, Bangladesh, and Indonesia are some of the leading rice-producing countries in Asia-Pacific. Since the consumption of rice products is high in the region owing to its cost-effectiveness. In 2021, China produced around 212.84 million metric tons of rice. However, the country is projected to increase its rice production at the fastest rate, with a CAGR of 4.8%, by volume, during the forecast period.
- By form, isolates led the market in the F&B segment with an estimated Y-o-Y growth rate of 1.82% by volume in 2022. The demand for brown rice protein from organic sources is rising relative to white rice in the regional market, particularly in APAC and Europe. However, with the rising lifestyle health disorders, such as diabetes, the demand for hormonal disbalance organic protein surged. France had the highest prevalence of diabetes in Europe (25.2%).
- Due to the increasing demand for protein supplements and intolerance to animal proteins in North America, consumers are switching more frequently to vegan diets, driving the rice protein market. The increasing popularity of veganism can be attributed to Americans' awareness of the negative environmental impact of animal-based diets. This has surged the rice protein market with a volume share of 10.87% in 2022.
- The Middle East is projected to record the highest CAGR of 5.05%, by value, during the forecast period. The growth is due to the outbreak of the COVID-19 pandemic, due to which consumption patterns changed as people prefer having protein in fortified and functional products to increase their nutritional intake.
Global Rice Protein Market Trends
Due to several health benefits of plant protein-based diets, customers are moving toward vegan offerings
- Globally, consumers are shifting their dietary preferences. Notably, there is a growing preference for dairy and meat alternatives, especially among consumers in Europe and North America. In 2022, Europe led the way with plant-based milk accounting for 38% of total plant-based food sales, followed closely by plant-based meat. This evolving trend is boosting the number of flexitarian and vegan consumers and opening doors for manufacturers to innovate within the plant protein sector.
- The popularity of plant-based protein alternatives is due to their nutritional value and stems from growing concerns over environmental impact, ethics, and health. Proteins, known for their slower digestion compared to carbohydrates, play a crucial role in weight management by promoting a longer-lasting feeling of fullness with fewer calories. A new study reveals that over one billion people globally were living with obesity between 2022 and 2023.
- Moreover, the rising engagement of the younger population in sports and fitness activities, coupled with a growing trend of fortifying food and beverages with functional ingredients for added health benefits, is fueling the demand for plant-based proteins. In 2023, a record-high 242 million Americans aged 6 and older (nearly 80% of the population) participated in at least one sport or fitness activity, a 2.2% increase from 2022. This active lifestyle shift is driving the demand for plant-based protein food products. Furthermore, government initiatives, such as Canada's Health Ministry, which revamped its food guide, emphasizing three key categories: vegetables and fruits, whole grains, and plant-based proteins, are driving awareness and demand for alternative proteins among consumers.
Asia-Pacific leads global rice production, with other major countries relying on imports from this region
- Asia-Pacific produces the majority of the world's rice. It is the staple food in the region. China, India, Bangladesh, and Indonesia are some of the key leading rice-producing countries. Other top rice-producing countries in Asia include Indonesia, Bangladesh, Vietnam, Thailand, Myanmar, the Philippines, and Japan. In 2021, China produced around 212.84 million metric tons of rice. Although rice is produced over vast areas of the world, the physical requirements for growing it are limited to certain areas.
- In Asia, nearly 60% of the 130 million hectares devoted to rice production annually is irrigated, where rice is often grown in monoculture with two to three crops a year, depending upon water availability. China, India, Indonesia, Bangladesh, Vietnam, Thailand, Myanmar, the Philippines, Pakistan, and Brazil are the top 10 rice-producing countries. With 84% of rice being harvested in just ten countries, many countries globally rely on imports to meet domestic demand. As the global population continues to rise, rice will continue to be a major source of calories and nutrition.
- Rice is considered a vital part of nutrition in much of Asia, Latin America, Africa, and the Caribbean and is estimated to provide more than one-fifth of the calories consumed globally, impacting the production of rice and processing it into various products, as it is a widely accepted protein crop. Sub-Saharan Africa is the largest rice-importing region, slightly exceeding total imports by all of Asia and accounting for more than 31% of global imports. The Middle East remains a large global import market, accounting for more than 70% of the region's rice consumption.
Rice Protein Industry Overview
The Rice Protein Market is fragmented, with the top five companies occupying 29.78%. The major players in this market are A. Costantino & C. spa, ETChem, Kerry Group plc, Sudzucker AG and The Scoular Company (sorted alphabetically).
Additional Benefits:
- The market estimate (ME) sheet in Excel format
- 3 months of analyst support
Product Code: 90232
TABLE OF CONTENTS
1 EXECUTIVE SUMMARY & KEY FINDINGS
2 INTRODUCTION
- 2.1 Study Assumptions & Market Definition
- 2.2 Scope of the Study
- 2.3 Research Methodology
3 KEY INDUSTRY TRENDS
- 3.1 End User Market Volume
- 3.1.1 Baby Food and Infant Formula
- 3.1.2 Bakery
- 3.1.3 Beverages
- 3.1.4 Breakfast Cereals
- 3.1.5 Condiments/Sauces
- 3.1.6 Confectionery
- 3.1.7 Dairy and Dairy Alternative Products
- 3.1.8 Elderly Nutrition and Medical Nutrition
- 3.1.9 Meat/Poultry/Seafood and Meat Alternative Products
- 3.1.10 RTE/RTC Food Products
- 3.1.11 Snacks
- 3.1.12 Sport/Performance Nutrition
- 3.1.13 Animal Feed
- 3.1.14 Personal Care and Cosmetics
- 3.2 Protein Consumption Trends
- 3.2.1 Plant
- 3.3 Production Trends
- 3.3.1 Plant
- 3.4 Regulatory Framework
- 3.4.1 China
- 3.4.2 United States
- 3.5 Value Chain & Distribution Channel Analysis
4 MARKET SEGMENTATION (includes market size in Value in USD and Volume, Forecasts up to 2030 and analysis of growth prospects)
- 4.1 Form
- 4.1.1 Concentrates
- 4.1.2 Isolates
- 4.1.3 Textured/Hydrolyzed
- 4.2 End User
- 4.2.1 Food and Beverages
- 4.2.1.1 By Sub End User
- 4.2.1.1.1 Bakery
- 4.2.1.1.2 Beverages
- 4.2.1.1.3 Meat/Poultry/Seafood and Meat Alternative Products
- 4.2.1.1.4 Snacks
- 4.2.2 Personal Care and Cosmetics
- 4.2.3 Supplements
- 4.2.3.1 By Sub End User
- 4.2.3.1.1 Elderly Nutrition and Medical Nutrition
- 4.2.3.1.2 Sport/Performance Nutrition
- 4.2.1 Food and Beverages
- 4.3 Region
- 4.3.1 Africa
- 4.3.1.1 By Form
- 4.3.1.2 By End User
- 4.3.1.3 By Country
- 4.3.1.3.1 Nigeria
- 4.3.1.3.2 South Africa
- 4.3.1.3.3 Rest of Africa
- 4.3.2 Asia-Pacific
- 4.3.2.1 By Form
- 4.3.2.2 By End User
- 4.3.2.3 By Country
- 4.3.2.3.1 Australia
- 4.3.2.3.2 China
- 4.3.2.3.3 India
- 4.3.2.3.4 Indonesia
- 4.3.2.3.5 Japan
- 4.3.2.3.6 Malaysia
- 4.3.2.3.7 New Zealand
- 4.3.2.3.8 South Korea
- 4.3.2.3.9 Thailand
- 4.3.2.3.10 Vietnam
- 4.3.2.3.11 Rest of Asia-Pacific
- 4.3.3 Europe
- 4.3.3.1 By Form
- 4.3.3.2 By End User
- 4.3.3.3 By Country
- 4.3.3.3.1 Belgium
- 4.3.3.3.2 France
- 4.3.3.3.3 Germany
- 4.3.3.3.4 Italy
- 4.3.3.3.5 Netherlands
- 4.3.3.3.6 Russia
- 4.3.3.3.7 Spain
- 4.3.3.3.8 Turkey
- 4.3.3.3.9 United Kingdom
- 4.3.3.3.10 Rest of Europe
- 4.3.4 Middle East
- 4.3.4.1 By Form
- 4.3.4.2 By End User
- 4.3.4.3 By Country
- 4.3.4.3.1 Iran
- 4.3.4.3.2 Saudi Arabia
- 4.3.4.3.3 United Arab Emirates
- 4.3.4.3.4 Rest of Middle East
- 4.3.5 North America
- 4.3.5.1 By Form
- 4.3.5.2 By End User
- 4.3.5.3 By Country
- 4.3.5.3.1 Canada
- 4.3.5.3.2 Mexico
- 4.3.5.3.3 United States
- 4.3.5.3.4 Rest of North America
- 4.3.6 South America
- 4.3.6.1 By Form
- 4.3.6.2 By End User
- 4.3.6.3 By Country
- 4.3.6.3.1 Argentina
- 4.3.6.3.2 Brazil
- 4.3.6.3.3 Rest of South America
- 4.3.1 Africa
5 COMPETITIVE LANDSCAPE
- 5.1 Key Strategic Moves
- 5.2 Market Share Analysis
- 5.3 Company Landscape
- 5.4 Company Profiles (includes Global Level Overview, Market Level Overview, Core Business Segments, Financials, Headcount, Key Information, Market Rank, Market Share, Products and Services, and Analysis of Recent Developments).
- 5.4.1 A. Costantino & C. spa
- 5.4.2 Axiom Foods Inc.
- 5.4.3 ETChem
- 5.4.4 Green Source Organics
- 5.4.5 Kerry Group plc
- 5.4.6 Sudzucker AG
- 5.4.7 The Scoular Company
6 KEY STRATEGIC QUESTIONS FOR PROTEIN INGREDIENTS INDUSTRY CEOS
7 APPENDIX
- 7.1 Global Overview
- 7.1.1 Overview
- 7.1.2 Porter's Five Forces Framework
- 7.1.3 Global Value Chain Analysis
- 7.1.4 Market Dynamics (DROs)
- 7.2 Sources & References
- 7.3 List of Tables & Figures
- 7.4 Primary Insights
- 7.5 Data Pack
- 7.6 Glossary of Terms
Have a question?


SELECT AN OPTION
Have a question?
Questions? Please give us a call or visit the contact form.