
Need help finding what you are looking for?
Contact Us
PUBLISHER: Mordor Intelligence | PRODUCT CODE: 1690972

PUBLISHER: Mordor Intelligence | PRODUCT CODE: 1690972
United States Rice Protein - Market Share Analysis, Industry Trends & Statistics, Growth Forecasts (2025 - 2030)
PUBLISHED:
PAGES: 168 Pages
DELIVERY TIME: 2-3 business days
SELECT AN OPTION
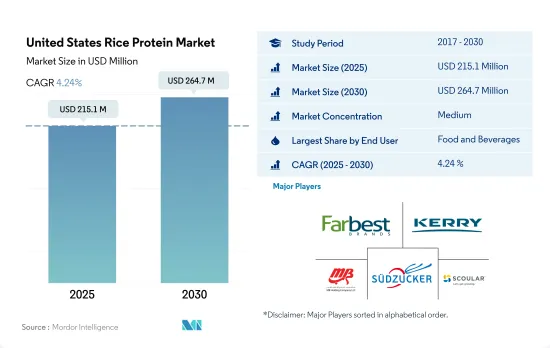
The United States Rice Protein Market size is estimated at 215.1 million USD in 2025, and is expected to reach 264.7 million USD by 2030, growing at a CAGR of 4.24% during the forecast period (2025-2030).
Growing lactose-intolerant population in the country and increasing protein consumption need is driving the use of rice protein
- Rice proteins witnessed maximum demand in the food and beverage segment, majorly led by meat/poultry/seafood and meat alternative products. In 2022, the sub-segment claimed more than 83% of rice proteins consumed in the country. Rice protein satiates multiple consumer demands, such as vegan, gluten-free, and high-protein food products. Rice proteins were used as meat extenders at different concentration levels (3%, 6%, 9%, and 12%) for the development of chicken nuggets. The segment for baking supplies and baking mixes may have extremely high demand as a result of the protein trend, which is only expected to intensify. To meet the growing demand for vegan bakery products, food producers are using rice protein to create protein-rich bakery items.
- The ingredient is gaining popularity for being hypoallergenic and a nutritious alternative for people dealing with lactose intolerance. The number of lactose-intolerant people in the country is around 30 million, leading to high demand for alternative proteins, including rice protein. Especially rice-based formulas have been used as a better alternative than soy milk for children with cow's milk allergy, as the human digestibility of polished rice protein is as high as 86-90%.
- In terms of growth, the personal care and cosmetics segment is set to outpace major categories in terms of growth, with a projected CAGR of 6.18% by value during the forecast period. This growth can be attributed to the rising demand for synthetic ingredients in beauty products. Consumers are increasingly embracing plant-based substitutes such as rice proteins, thus leading to market expansion.
United States Rice Protein Market Trends
Growth in plant protein consumption provides opportunities for key players in the ingredients market
- The per capita consumption rate of plant proteins is increasing at a considerable rate in the United States, supported by investments and innovations, resulting in a consumption rate of 40.28 grams per day, primarily due to a rising number of consumers turning vegan to promote animal welfare. This is because factory farming, where animals are maltreated, is a norm in the United States. Most Americans eat less meat and animal products, but they do not eliminate their consumption entirely. They also tend to be more flexitarian than vegan or vegetarian. Nearly 12% of consumers in the country prefer a plant-based diet, whereas 7% of consumers follow a flexitarian diet. Although consumers of all generations in the United States are interested in plant-based meals, individuals in their 20s and 30s are the keenest to adopt plant-based diets.
- There is a constant rise in the per capita consumption of pea protein due to its wide applications in different food products, like meat, poultry, and bakery products. Around 41% of consumers are interested in plant-based food derived from pea protein. Pea protein is mainly used in sports nutrition and meat alternatives. A typical serving of pea protein powder is 30 grams, with 25 grams of protein. Athletes usually use one serving per day but may take as many as three servings per day.
- Soy and whey proteins are used primarily in the food and beverage, supplement, and sports nutrition industries. In 2021, around 36% of consumers were familiar with soy protein and had consumed the same, whereas 31% of individuals consumed whey protein in the US. Similarly, the consumption of soy-based food and beverages favorably increased by 12.9% during 2014-2019, and it is likely to remain consistent throughout the forecast period.
Increase in rice production to support rice protein processors
- Functional foods, particularly dietary supplements, are emerging as one of the largest application areas of rice protein, as manufacturers are embracing the blending approach for plant protein-based products. Arkansas Grand Prairie, Mississippi Delta, Gulf Coast, and Sacramento Valley of California are four regions producing almost the entire US rice crop. Each of these regions normally specializes in a specific type of rice, referred to in the United States by length of grain, i.e., long, medium, and short. In general, long-grain production accounts for approximately 75% of US rice production, medium-grain production accounts for about 24%, and short-grain accounts for the remaining approximately 1%.
- In 2021, the United States produced 191.6 million hundredweight (cwt) of rough rice, down by 16% from 2020 but still slightly above the 2019 crop. The 2022 rice crop of 160.4 million cwt was also 16% below a year earlier, with drought in California a major factor behind declining US rice production in both 2021 and 2022.
- US long-grain rice production is concentrated in the South (e.g., Arkansas typically grows 56-58% of the US long-grain crop.) California is the main producer of medium-grain rice, typically growing 70-77% of the crop, although Arkansas grows a substantial amount of medium-grain rice, especially in years when California is experiencing drought.
- The United States is a consistent, timely supplier of high-quality rice in both the long and combined medium and short-grain global markets. Although the United States accounts for less than 2% of global rice production, it ships almost 5% of global exports, and it was the fifth-largest exporter as of 2023.
United States Rice Protein Industry Overview
The United States Rice Protein Market is moderately consolidated, with the top five companies occupying 58.38%. The major players in this market are Farbest-Tallman Foods Corporation, Kerry Group PLC, MB-Holding GmbH & Co. KG, Sudzucker Group and The Scoular Company (sorted alphabetically).
Additional Benefits:
- The market estimate (ME) sheet in Excel format
- 3 months of analyst support
Product Code: 90072
TABLE OF CONTENTS
1 EXECUTIVE SUMMARY & KEY FINDINGS
2 INTRODUCTION
- 2.1 Study Assumptions & Market Definition
- 2.2 Scope of the Study
- 2.3 Research Methodology
3 KEY INDUSTRY TRENDS
- 3.1 End User Market Volume
- 3.1.1 Baby Food and Infant Formula
- 3.1.2 Bakery
- 3.1.3 Beverages
- 3.1.4 Breakfast Cereals
- 3.1.5 Condiments/Sauces
- 3.1.6 Confectionery
- 3.1.7 Dairy and Dairy Alternative Products
- 3.1.8 Elderly Nutrition and Medical Nutrition
- 3.1.9 Meat/Poultry/Seafood and Meat Alternative Products
- 3.1.10 RTE/RTC Food Products
- 3.1.11 Snacks
- 3.1.12 Sport/Performance Nutrition
- 3.1.13 Animal Feed
- 3.1.14 Personal Care and Cosmetics
- 3.2 Protein Consumption Trends
- 3.2.1 Plant
- 3.3 Production Trends
- 3.3.1 Plant
- 3.4 Regulatory Framework
- 3.4.1 United States
- 3.5 Value Chain & Distribution Channel Analysis
4 MARKET SEGMENTATION (includes market size in Value in USD and Volume, Forecasts up to 2030 and analysis of growth prospects)
- 4.1 Form
- 4.1.1 Concentrates
- 4.1.2 Isolates
- 4.1.3 Textured/Hydrolyzed
- 4.2 End User
- 4.2.1 Food and Beverages
- 4.2.1.1 By Sub End User
- 4.2.1.1.1 Bakery
- 4.2.1.1.2 Beverages
- 4.2.1.1.3 Meat/Poultry/Seafood and Meat Alternative Products
- 4.2.1.1.4 Snacks
- 4.2.2 Personal Care and Cosmetics
- 4.2.3 Supplements
- 4.2.3.1 By Sub End User
- 4.2.3.1.1 Elderly Nutrition and Medical Nutrition
- 4.2.3.1.2 Sport/Performance Nutrition
- 4.2.1 Food and Beverages
5 COMPETITIVE LANDSCAPE
- 5.1 Key Strategic Moves
- 5.2 Market Share Analysis
- 5.3 Company Landscape
- 5.4 Company Profiles (includes Global Level Overview, Market Level Overview, Core Business Segments, Financials, Headcount, Key Information, Market Rank, Market Share, Products and Services, and Analysis of Recent Developments).
- 5.4.1 Axiom Foods Inc.
- 5.4.2 Farbest-Tallman Foods Corporation
- 5.4.3 Green Source Organics
- 5.4.4 Kerry Group PLC
- 5.4.5 MB-Holding GmbH & Co. KG
- 5.4.6 Sweet Additions LLC
- 5.4.7 Sudzucker Group
- 5.4.8 The Scoular Company
6 KEY STRATEGIC QUESTIONS FOR PROTEIN INGREDIENTS INDUSTRY CEOS
7 APPENDIX
- 7.1 Global Overview
- 7.1.1 Overview
- 7.1.2 Porter's Five Forces Framework
- 7.1.3 Global Value Chain Analysis
- 7.1.4 Market Dynamics (DROs)
- 7.2 Sources & References
- 7.3 List of Tables & Figures
- 7.4 Primary Insights
- 7.5 Data Pack
- 7.6 Glossary of Terms
Have a question?


SELECT AN OPTION
Have a question?
Questions? Please give us a call or visit the contact form.