
PUBLISHER: Mordor Intelligence | PRODUCT CODE: 1906963

PUBLISHER: Mordor Intelligence | PRODUCT CODE: 1906963
Polyethylene Terephthalate (PET) - Market Share Analysis, Industry Trends & Statistics, Growth Forecasts (2026 - 2031)
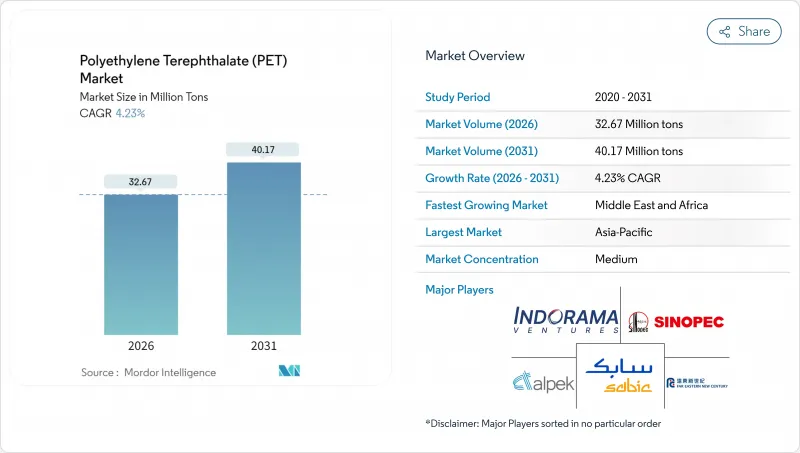
Polyethylene Terephthalate Market size in 2026 is estimated at 32.67 Million tons, growing from 2025 value of 31.34 Million tons with 2031 projections showing 40.17 Million tons, growing at 4.23% CAGR over 2026-2031.
Growth rests on the material's balance of barrier performance, cost-competitiveness, and recyclability, reinforcing its role in beverage packaging even as electronics and technical textiles widen the application base. Robust demand in Asia-Pacific, expanding regulatory mandates for recycled content, and technology advances in chemical recycling underpin volume expansion. Brand-owner sustainability pledges create predictable offtake for rPET (Recycled Polyethylene Terephthalate), while cost-focused procurement in emerging markets sustains virgin resin demand. Feedstock volatility and substitution threats from PEF (polyethylene furanoate) or aluminum introduce headwinds; nonetheless, investment in closed-loop systems and specialty grades positions the PET (Polyethylene Terephthalate) market for diversified growth.
Global Polyethylene Terephthalate (PET) Market Trends and Insights
Shift Toward Bottle-to-bottle Closed-loop Recycling
Collection rates of 75% for Polyethylene Terephthalate (PET) beverage bottles in Europe during 2024 pushed recycled content in new bottles to 24%, edging toward the 25% mandate effective end-2025. High-quality flakes diverted from tray applications tightened regional supply and kept European rPET (Recycled Polyethylene Terephthalate) premiums near USD 750-800 per ton above virgin resin. Mechanical recycling limits spur investment in catalytic glycolysis and pyrolysis, yet scale-up costs and feedstock variability restrain immediate impact. Multinationals continue to co-finance infrastructure to secure feedstock, redefining long-term procurement strategies within the Polyethylene Terephthalate (PET) market.
Rapid Growth of Aseptic and Hot-fill PET Packaging in Emerging Markets
Emerging markets in Southeast Asia and Latin America accelerate the adoption of heat-set bottles as cold-chain gaps persist. Polyethylene Terephthalate (PET)'s thermal resistance enables ambient shelf life for juices and dairy drinks, reducing spoilage in areas with unreliable electricity. Premium pricing for heat-set grades favors incumbents with specialized equipment, while regulators increasingly cite aseptic packaging as a pillar of food-security policy. The trend widens the Polyethylene Terephthalate (PET) market beyond carbonated beverages and supports regional resin converters investing in stretch-blow molding upgrades.
Volatility in PX (Paraxylene) and MEG (Mono Ethylene Glycol) Feedstock Prices
Paraxylene (PX) and Mono Ethylene Glycol (MEG) account for roughly 85% of PET variable cost, tying margins to crude oil swings. Integrated Asian complexes enjoy logistic advantages, whereas European and North American makers absorb freight and energy premiums. Geopolitical disruptions and shipping constraints recently widened inter-regional price gaps, eroding export competitiveness for standalone plants. Hedging tools offer partial relief but increase contract complexity, particularly for small converters lacking balance-sheet strength.
Other drivers and restraints analyzed in the detailed report include:
- Expansion of Filament-grade PET in Technical Textiles
- Brand-owner Pledges for 50 % rPET (Recycled Polyethylene Terephthalate) Content by 2030
- Substitution Threat from PEF and Aluminum
For complete list of drivers and restraints, kindly check the Table Of Contents.
Segment Analysis
Virgin resin accounted for 76.10% of global shipments in 2025-roughly 23.85 million tons-owing to cost efficiency and uniform quality. Recycled PET, at just under 7.5 million tons, posted the steepest 8.02% CAGR projection as mandates and brand targets raise demand. Europe led adoption, with 39% of locally produced rPET re-entering bottles in 2024, yet tight feedstock and separate-collection gaps sustained price premiums of USD 150-200 per ton over virgin in North America and up to USD 800 per ton in the EU (European Union).
Mechanical recycling limitations in color and contamination have accelerated interest in chemical depolymerization, though capital intensity impedes widespread roll-out before 2028. Investment in food-grade pelletizing lines expands usable rPET fraction, narrowing the cost differential. Virgin suppliers hedge with captive recycling units to secure bale access, reframing competition along the virgin-recycled continuum in the evolving PET market.
The Polyethylene Terephthalate (PET) Market Report is Segmented by Source Type (Virgin PET and Recycled PET), End User Industry (Automotive, Building and Construction, Electrical and Electronics, Industrial and Machinery, and Other End-User Industries), and Geography (North America, South America, Europe, Asia-Pacific, and Middle East and Africa). The Market Forecasts are Provided in Terms of Volume (Tons) and Value (USD).
Geography Analysis
Asia-Pacific dominated with 47.10% of the 2025 volume, nearly 14.8 million tons, due to integrated feedstock capacity and burgeoning consumer demand. China retains the largest production base, while India's consumption accelerates through packaged food growth and recycling investments. Southeast Asian nations such as Indonesia and Thailand add capacity to serve regional beverage and textile hubs. Indorama Ventures strengthened its local footprint via a joint venture with Varun Beverages, illustrating the strategy of coupling scale with local market access.
Europe and North America contribute smaller shares but lead in regulatory frameworks that stimulate rPET uptake. The EU recorded a PET bottle recycling rate of 75% in 2024, driving domestic rPET demand above global norms. High energy and labor costs pressure local producers, but proximity to brand owners seeking low-carbon packaging supports high-value specialty production. North America benefits from shale-based feedstock economics; however, import pressure from Asia tempers margin gains, pushing producers toward technical and recycled grades to remain competitive in the PET market.
The Middle East and Africa region exhibited the fastest 5.05% CAGR outlook. Gulf producers exploit advantaged feedstocks, and companies such as Borouge plan capacity beyond 6.6 million tons per year by 2028, targeting exports to Asia and Africa. Domestic demand rises with urbanization and infrastructure spending, particularly for bottled water and dairy beverages. Political instability and water scarcity pose challenges, yet feedstock economics and geographic location between Europe and Asia provide strategic shipping routes.
- Alpek S.A.B. de C.V.
- CR Chemical Materials Technology Inc.
- Far Eastern New Century Co., Ltd.
- Hengli Group Co. Ltd
- Indorama Ventures Public Company Limited.
- LOTTE Chemical CORPORATION
- Mitsubishi Chemical Group Corporation
- NAN YA Plastics Industrial Co., Ltd.
- Reliance Industries Limited
- SABIC
- Sanfangxiang Group Co., Ltd.
- Sinopec (China Petrochemical Corporation)
- Zhejiang Hengyi Group Co., Ltd.
- Zhink Group Co., Ltd.
Additional Benefits:
- The market estimate (ME) sheet in Excel format
- 3 months of analyst support
TABLE OF CONTENTS
1 Introduction
- 1.1 Study Assumptions and Market Definition
- 1.2 Scope of the Study
2 Research Methodology
3 Executive Summary
4 Market Landscape
- 4.1 Market Overview
- 4.2 Market Drivers
- 4.2.1 Shift Toward Bottle-to-bottle Closed-loop Recycling
- 4.2.2 Rapid Growth of Aseptic and Hot-fill PET Packaging in Emerging Markets
- 4.2.3 Expansion of Filament-grade PET in Technical Textiles
- 4.2.4 Brand-owner Pledges for 50 % rPET Content by 2030
- 4.2.5 Government Mandates on Single-use Plastics Substitution
- 4.3 Market Restraints
- 4.3.1 Volatility in PX and MEG Feedstock Prices
- 4.3.2 Bottle-to-fibre Down-cycling Oversupply Risk
- 4.3.3 Substitution Threat from PEF and Aluminum
- 4.4 Value Chain Analysis
- 4.5 Porter's Five Forces
- 4.5.1 Threat of New Entrants
- 4.5.2 Bargaining Power of Suppliers
- 4.5.3 Bargaining Power of Buyers
- 4.5.4 Threat of Substitutes
- 4.5.5 Competitive Rivalry
- 4.6 Import And Export Trends
- 4.7 Price Trends
- 4.8 Form Trends
- 4.9 Recycling Overview
- 4.10 Regulatory Framework
- 4.11 End-use Sector Trends
- 4.11.1 Aerospace (Aerospace Component Production Revenue)
- 4.11.2 Automotive (Automobile Production)
- 4.11.3 Building and Construction (New Construction Floor Area)
- 4.11.4 Electrical and Electronics (Electrical and Electronics Production Revenue)
- 4.11.5 Packaging(Plastic Packaging Volume)
5 Market Size and Growth Forecasts (Value and Volume)
- 5.1 By Source Type
- 5.1.1 Virgin PET
- 5.1.2 Recycled PET (rPET)
- 5.2 By End User Industry
- 5.2.1 Automotive
- 5.2.2 Building and Construction
- 5.2.3 Electrical and Electronics
- 5.2.4 Industrial and Machinery
- 5.2.5 Packaging
- 5.2.6 Other End-user Industries
- 5.3 By Geography
- 5.3.1 Asia-Pacific
- 5.3.1.1 China
- 5.3.1.2 India
- 5.3.1.3 Japan
- 5.3.1.4 South Korea
- 5.3.1.5 Australia
- 5.3.1.6 Malaysia
- 5.3.1.7 Rest of Asia-Pacific
- 5.3.2 North America
- 5.3.2.1 United States
- 5.3.2.2 Canada
- 5.3.2.3 Mexico
- 5.3.3 Europe
- 5.3.3.1 Germany
- 5.3.3.2 France
- 5.3.3.3 United Kingdom
- 5.3.3.4 Italy
- 5.3.3.5 Russia
- 5.3.3.6 Rest of Europe
- 5.3.4 South America
- 5.3.4.1 Brazil
- 5.3.4.2 Argentina
- 5.3.4.3 Rest of South America
- 5.3.5 Middle East and Africa
- 5.3.5.1 Saudi Arabia
- 5.3.5.2 United Arab Emirates
- 5.3.5.3 South Africa
- 5.3.5.4 Nigeria
- 5.3.5.5 Rest of Middle East and Africa
- 5.3.1 Asia-Pacific
6 Competitive Landscape
- 6.1 Market Concentration
- 6.2 Strategic Moves
- 6.3 Market Share (%)**/Ranking Analysis
- 6.4 Company Profiles (includes Global Level Overview, Market Level Overview, Core Segments, Financials as available, Strategic Information, Market Rank/Share for key companies, Products and Services, and Recent Developments)
- 6.4.1 Alpek S.A.B. de C.V.
- 6.4.2 CR Chemical Materials Technology Inc.
- 6.4.3 Far Eastern New Century Co., Ltd.
- 6.4.4 Hengli Group Co. Ltd
- 6.4.5 Indorama Ventures Public Company Limited.
- 6.4.6 LOTTE Chemical CORPORATION
- 6.4.7 Mitsubishi Chemical Group Corporation
- 6.4.8 NAN YA Plastics Industrial Co., Ltd.
- 6.4.9 Reliance Industries Limited
- 6.4.10 SABIC
- 6.4.11 Sanfangxiang Group Co., Ltd.
- 6.4.12 Sinopec (China Petrochemical Corporation)
- 6.4.13 Zhejiang Hengyi Group Co., Ltd.
- 6.4.14 Zhink Group Co., Ltd.
7 Market Opportunities and Future Outlook
- 7.1 White-space and Unmet-Need Assessment
- 7.2 AI-driven Technologies to Optimize Processes
8 Key Strategic Questions for CEOs

