
Need help finding what you are looking for?
Contact Us
PUBLISHER: Mordor Intelligence | PRODUCT CODE: 1693502

PUBLISHER: Mordor Intelligence | PRODUCT CODE: 1693502
United States Controlled Release Fertilizer - Market Share Analysis, Industry Trends & Statistics, Growth Forecasts (2025 - 2030)
PUBLISHED:
PAGES: 139 Pages
DELIVERY TIME: 2-3 business days
SELECT AN OPTION
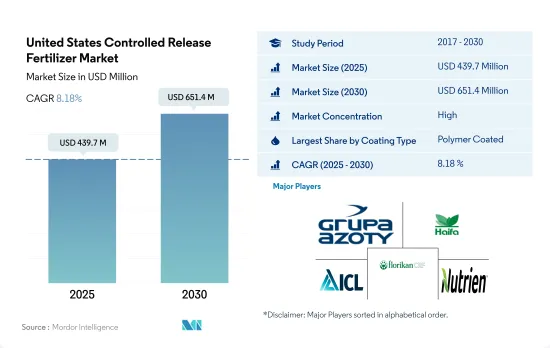
The United States Controlled Release Fertilizer Market size is estimated at 439.7 million USD in 2025, and is expected to reach 651.4 million USD by 2030, growing at a CAGR of 8.18% during the forecast period (2025-2030).
The efficiency of CRFs in reducing nitrogen and phosphorus leaching propels market growth
- The market for controlled-release fertilizers in the United States was valued at USD 428.7 million in 2022. With mounting pressure on the agriculture sector to mitigate environmental repercussions, coupled with the benefits of enhanced nutrient efficiency and precise application, the market value is projected to witness a robust CAGR of 8.0% from 2023 to 2030.
- Controlled-release fertilizers offer a gradual and prolonged nutrient release, ensuring crops receive a consistent supply of vital elements throughout their growth cycle. By curbing nutrient leaching and runoff, these fertilizers play a pivotal role in reducing the environmental impact of field crop agriculture, particularly in addressing concerns about water quality and pollution.
- Field trials have shown that coated controlled-release fertilizers outperform their uncoated counterparts, reducing leaching by 69.0% for nitrogen-based fertilizers and 82.0% for phosphate-based ones. In contrast, uncoated conventional urea can lose up to 40% of its ammonia content through volatilization. Extensive testing over multiple years has consistently demonstrated that coated urea can slash ammonia losses by a minimum of 95.0%.
- In 2022, polymer coating dominated the United States controlled-release fertilizer market, accounting for 76.4% of the industry. Environmental and cost considerations are driving the demand for polymer-coated controlled-release fertilizers, thanks to the nation's focus on field crop cultivation. The polymer-coated segment is expected to witness a healthy growth rate of 7.7% from 2023 to 2030.
- The United States is witnessing a surge in demand for controlled-release fertilizers, propelled by government regulations aimed at curbing the environmental impact stemming from excessive fertilizer accumulation.
United States Controlled Release Fertilizer Market Trends
Soybean and corn are the two prominent crops grown in the United States
- In the United States, the population increased from 335.9 million in 2020 to 338.2 million in 2022. From 2000 onwards, the total farmland area decreased by almost 50 million acres, reaching a total of 893.4 million acres in 2022. The limited farmland indicates the need to increase agricultural productivity with the use of agri inputs. Fertilizers have been used for a long time to increase the productivity of crops. The four major crops in the United States are corn, cotton, soybean, and wheat, which account for more than 65.7% of the principal crop acreage in 2022.
- Soybean and corn are the two prominent crops grown in the United States. In 2022, soybean had the highest area under cultivation, accounting for 25.8% of the total arable land in the United States, followed by corn at 25.7% and wheat at 11.1%. The majority of these crops are grown in a region known as the "Corn Belt," which covers Western Indiana, Illinois, Iowa, Missouri, Eastern Nebraska, and Eastern Kansas. The production of corn (maize) and soybeans dominates this area. Additionally, the United States is a major exporter of rice, with most of the cultivation happening in four regions, three of which are in the South and one in California, according to the USDA.
- Manufacturers of farm inputs are developing innovative products to assist farmers with the precise application of fertilizers. This is helping farmers in reducing the cost of cultivation while increasing efficiency. The field crop industry of the country has immense market potential, and with increased government funding and support, it is expected to drive positive growth in crop cultivation in this area.
Nitrogen deficiency is one of the most prevalent crop nutrient problems across cropping areas in the United States
- The average application rate of primary nutrients (nitrogen, potassium, and phosphorus) in field crops in the United States stood at approximately 166.61 kg per hectare in the year 2022. Nitrogen represented 45.93% of this application, followed by potassium at 28.11% and phosphorus at 25.96% in the same year.
- Rapeseed/canola stands out among field crops, with an average primary nutrient application rate of 284.92 kg per hectare, the highest in this sector in 2022. Among the primary nutrients, nitrogen takes the lead, with an average application rate of 229.60 kg per hectare. This dominance can be attributed to nitrogen's pivotal role in plant metabolism, as it is a key component of both chlorophyll and amino acids.
- In the United States, corn/maize stands as the second-largest field crop, with rapeseed/canola following closely behind. On average, farmers applied 245.40 kg of primary nutrients per hectare in 2022. Corn alone contributes to around 31.44% of the nation's total field crop production. When it came to primary nutrient application, corn's nitrogen requirement accounted for 50.06%, phosphorus stood at 23.77%, and potash at 26.17% in 2022.
- Primary nutrients play a pivotal role in enhancing plant enzyme function, cellular growth, and biochemical processes. A deficiency in these nutrients can significantly impact plant health, stifle growth, and hamper crop yields. Given the rising need for increased productivity, the application of primary nutrients in field crops is expected to witness a notable uptick.
United States Controlled Release Fertilizer Industry Overview
The United States Controlled Release Fertilizer Market is fairly consolidated, with the top five companies occupying 89.58%. The major players in this market are Grupa Azoty S.A. (Compo Expert), Haifa Group, ICL Group Ltd, New Mountain Capital (Florikan) and Nutrien Ltd. (sorted alphabetically).
Additional Benefits:
- The market estimate (ME) sheet in Excel format
- 3 months of analyst support
Product Code: 92566
TABLE OF CONTENTS
1 EXECUTIVE SUMMARY & KEY FINDINGS
2 REPORT OFFERS
3 INTRODUCTION
- 3.1 Study Assumptions & Market Definition
- 3.2 Scope of the Study
- 3.3 Research Methodology
4 KEY INDUSTRY TRENDS
- 4.1 Acreage Of Major Crop Types
- 4.1.1 Field Crops
- 4.1.2 Horticultural Crops
- 4.2 Average Nutrient Application Rates
- 4.2.1 Primary Nutrients
- 4.2.1.1 Field Crops
- 4.2.1.2 Horticultural Crops
- 4.2.1 Primary Nutrients
- 4.3 Regulatory Framework
- 4.4 Value Chain & Distribution Channel Analysis
5 MARKET SEGMENTATION (includes market size in Value in USD and Volume, Forecasts up to 2030 and analysis of growth prospects)
- 5.1 Coating Type
- 5.1.1 Polymer Coated
- 5.1.2 Polymer-Sulfur Coated
- 5.1.3 Others
- 5.2 Crop Type
- 5.2.1 Field Crops
- 5.2.2 Horticultural Crops
- 5.2.3 Turf & Ornamental
6 COMPETITIVE LANDSCAPE
- 6.1 Key Strategic Moves
- 6.2 Market Share Analysis
- 6.3 Company Landscape
- 6.4 Company Profiles
- 6.4.1 AgroLiquid
- 6.4.2 Grupa Azoty S.A. (Compo Expert)
- 6.4.3 Haifa Group
- 6.4.4 ICL Group Ltd
- 6.4.5 New Mountain Capital (Florikan)
- 6.4.6 Nutrien Ltd.
7 KEY STRATEGIC QUESTIONS FOR FERTILIZER CEOS
8 APPENDIX
- 8.1 Global Overview
- 8.1.1 Overview
- 8.1.2 Porter's Five Forces Framework
- 8.1.3 Global Value Chain Analysis
- 8.1.4 Market Dynamics (DROs)
- 8.2 Sources & References
- 8.3 List of Tables & Figures
- 8.4 Primary Insights
- 8.5 Data Pack
- 8.6 Glossary of Terms
Have a question?


SELECT AN OPTION
Have a question?
Questions? Please give us a call or visit the contact form.