
PUBLISHER: Mordor Intelligence | PRODUCT CODE: 1835661

PUBLISHER: Mordor Intelligence | PRODUCT CODE: 1835661
Acute Lymphocytic Leukemia Therapeutics - Market Share Analysis, Industry Trends & Statistics, Growth Forecasts (2025 - 2030)
The acute lymphocytic leukemia therapeutics market stands at USD 3.79 billion in 2025 and is on track to reach USD 5.28 billion by 2030, reflecting a 6.87% CAGR.
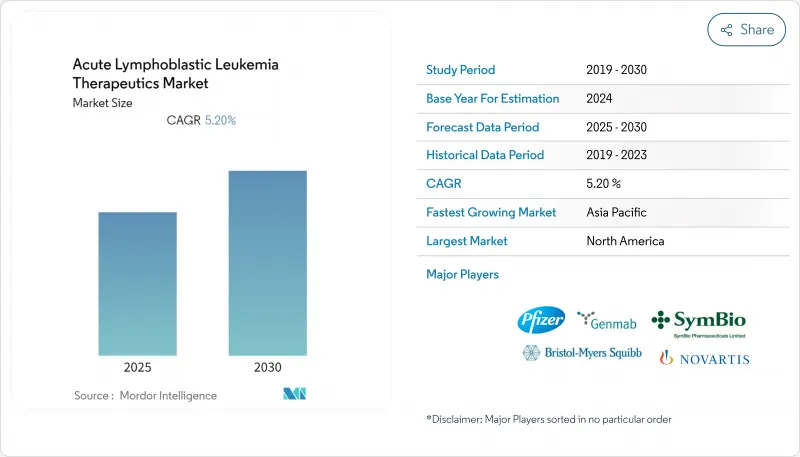
Growth rests on the clinical success of targeted agents, immunotherapies, and cell-based products that are redefining protocols once dominated by multi-agent chemotherapy. Asia-Pacific is delivering the fastest regional expansion at a projected 9.80% CAGR to 2030 as broader insurance coverage lifts diagnosis and treatment volumes in China and India. North America retains leadership with 37.6% of the 2024 revenue base, supported by high guideline adherence, rapid access to drug launches, and sustained reimbursement for high-ticket modalities such as CAR-T therapy. Pipeline strength is most visible in agents addressing Philadelphia chromosome-positive disease and KMT2A-rearranged subtypes, while the wider use of minimal residual disease (MRD) testing is shortening time to treatment modification. Pricing pressures remain a structural headwind; a single CAR-T course averages USD 525,000 and continues to challenge equitable uptake in middle-income countries.
Global Acute Lymphocytic Leukemia Therapeutics Market Trends and Insights
High burden of ALL and pediatric cancer care programs
The acute lymphocytic leukemia therapeutics market continues to benefit from the sizable global incidence in children; 6,550 new U.S. cases appeared in 2024, and ALL represents 80% of childhood leukemias lls.org. Dedicated pediatric consortia have raised survival benchmarks, typified by a Children's Oncology Group phase 3 study in which blinatumomab lifted three-year disease-free survival from 87.9% to 96.0%.[1]. Worldwide prevalence among children reached 168,879 cases in 2021, up 59.06% versus in last 2 decades. Such statistics underpin sustained investment in pediatric-specific regimens and center-of-excellence infrastructure that collectively stimulate medicine uptake and guideline convergence.
Expanding R&D and clinical-trial pipeline
A prolific development ecosystem is reshaping therapeutic options. The July 2024 orphan and rare pediatric disease designations for UCART22 underscore regulator enthusiasm for next-generation allogeneic cell therapies. Revuforj (revumenib) entered the U.S. market in late 2024 with a 63% response rate in KMT2A-rearranged leukemias, validating menin inhibition as a viable strategy. Intensified CAR-T research now spans dual-antigen constructs and off-the-shelf platforms aimed at reducing manufacturing lag, widening patient eligibility, and supporting acute lymphocytic leukemia therapeutics market scale-up.
High therapy cost and reimbursement gaps
Unit pricing remains the biggest drag on acute lymphocytic leukemia therapeutics market penetration. Obecabtagene autoleucel carries a USD 525,000 list price. Hospitalization and supportive-care add-ons widen the affordability gap, and many payers apply prior-authorization hurdles that can delay infusion timing. U.S. Medicare's 2025 fee-schedule update introduced navigation codes and inflation rebates; still, significant out-of-pocket exposure persists, especially in commercially insured or self-funded plans.
Other drivers and restraints analyzed in the detailed report include:
- Accelerated and other expedited approvals
- Wider use of liquid biopsy and MRD testing
- Severe side effects, relapse risk and drug resistance
For complete list of drivers and restraints, kindly check the Table Of Contents.
Segment Analysis
The acute lymphocytic leukemia therapeutics market size for B-cell precursor disease was anchored by a 40.4% revenue share in 2024. Dominance reflects the depth of CD19-directed CAR-T offerings, bispecific antibodies, and MRD-driven algorithms that support durable remissions. Ponatinib-based regimens have re-defined outcomes for Philadelphia chromosome-positive disease, which is projected to deliver a 9.20% CAGR to 2030. T-cell disease remains less penetrated, yet early-phase data for CD7-targeting CAR-T therapy show a 94% complete response rate, indicating meaningful white-space growth potential.
Treatment innovation is progressively stratifying subsegments by genetic lesion, with menin inhibitors offering newfound control for KMT2A-rearranged cases. As MRD testing proves cost-effective, optimization of follow-up therapy is expected to squeeze historical relapse rates, widening the performance gap between well-resourced centers and low-resource settings inside the acute lymphocytic leukemia therapeutics market.
Chemotherapy retained a 39.9% share in 2024, supported by entrenched multi-agent protocols. Yet targeted therapy is forecast to outpace all other classes at an 8.40% CAGR, energised by accelerated approvals for ponatinib, revumenib, and successive bispecific antibodies. CD19-directed CAR-T products such as tisagenlecleucel and obecabtagene autoleucel have redefined salvage lines; a pivotal study logged a 76% overall remission rate with improved neurotoxicity safety profiles.
Next-generation strategies aim to deliver allogeneic and dual-targeting constructs that deepen response and abate manufacturing delays. Allogeneic transplantation remains a curative pillar for high-risk phenotypes, while radiation keeps its niche for central nervous system prophylaxis or conditioning regimens. Collectively these shifts underpin a gradual yet decisive tilt toward precision modalities inside the acute lymphocytic leukemia therapeutics market.
The Acute Lymphocytic Leukemia Therapeutics Market Report is Segmented by Cell Type (B-Cell Precursor ALL, T-Cell all and More), Therapy (Chemotherapy, Targeted Therapy, Radiation Therapy and More), Age Group (Pedriatric, Adults and More), Line of Therapy (Firstline, Second Line and More), Route of Administration (Intravenous and Oral) and Geography. The Market and Forecasts are Provided in Terms of Value (USD)
Geography Analysis
North America retained 37.6% of 2024 revenue, buoyed by 62,770 total leukemia diagnoses that year and 6,550 incident ALL cases. The FDA cleared revumenib and ponatinib-plus-chemotherapy during 2024, underscoring a robust authorization cadence that keeps novel agents accessible early. High insurance coverage and established MRD testing protocols continue to shorten treatment-to-response intervals and reinforce premium pricing power in the acute lymphocytic leukemia therapeutics market.
Asia-Pacific is expanding faster than any other region at a 9.80% CAGR. Health-care access reforms in China and India are improving screening volumes, while local innovation is assembling a domestic pipeline. China's approval of zevorcabtagene autoleucel for multiple myeloma illustrates regulatory readiness for cell therapy, and real-world evidence on ORG-101 posted complete response rates above 80% in adult B-ALL. Nevertheless, rural-urban gaps in diagnostic reach and therapy affordability remain pronounced, moderating absolute penetration despite strong percentage growth.
Europe maintains a material share through centralized health systems and wide clinical-trial participation. The European Medicines Agency has extended several leukemia indications-Bosulif and Calquence among them-and continues to tailor adaptive pathways for advanced therapies. Middle East and Africa and South America occupy smaller slices of the acute lymphocytic leukemia therapeutics market; tertiary centers in large cities are adding MRD and CAR-T capabilities, yet macro-economic and infrastructure limits restrain diffusion. Burden-of-disease analyses show incidence is falling in higher-income locales while trending upward in lower-income ones, spotlighting the public-health imperative of region-specific funding models.
- Amgen
- Jazz Pharmaceuticals
- Novartis
- Pfizer
- Roche
- Johnson & Johnson
- Gilead Sciences
- Medac GmbH
- Takeda Pharmaceutical Co.
- Autolus Therapeutics plc
- BeiGene Ltd.
- Servier Group
- Merck
- Abbvie
- Syndax Pharmaceuticals
- Vironexis Biotherapeutics.
- Ascentage Pharma
Additional Benefits:
- The market estimate (ME) sheet in Excel format
- 3 months of analyst support
TABLE OF CONTENTS
1 Introduction
- 1.1 Study Assumptions and Market Definition
- 1.2 Scope of the Study
2 Research Methodology
3 Executive Summary
4 Market Landscape
- 4.1 Market Overview
- 4.2 Market Drivers
- 4.2.1 High Burden of Acute Lymphocyctic Leukemia Coupled with Pediatric Care Cancer Programs
- 4.2.2 Increasing Research and Develeopment Initiatives Coupled with Expanding Clinical Trials and Pipeline Drugs
- 4.2.3 Favorable Regulatory Initiatives such as Accelerated Approvals
- 4.2.4 Growing Application of Liquid Biopsy and Minimal Residual Disease Testing
- 4.2.5 Advancements in Target Therapies
- 4.2.6 Shift Toward Off-the-Shelf Allogeneic CAR-T Platforms Accelerating Commercial Scalability and Patient Eligibility
- 4.3 Market Restraints
- 4.3.1 High Treatment Cost and Reimbursement Issues
- 4.3.2 Risk of Side Effects Coupled with Relapse and Treatment Resistance
- 4.3.3 Disparities in Healthcare Access and Uncertain Long Term Outcomes of Novel Therapies
- 4.3.4 Limited Viral-Vector Manufacturing Capacity Causing Production Delays and Supply Constraints for Advanced Therapies
- 4.4 Value / Supply-Chain Analysis
- 4.5 Regulatory and Technological Outlook
- 4.6 Porter's Five Forces Analysis
- 4.6.1 Threat of New Entrants
- 4.6.2 Bargaining Power of Buyers
- 4.6.3 Bargaining Power of Suppliers
- 4.6.4 Threat of Substitutes
- 4.6.5 Competitive Rivalry
5 Market Size and Growth Forecasts (Value - USD)
- 5.1 By Cell Type
- 5.1.1 B-Cell Precursor ALL
- 5.1.2 T-Cell ALL
- 5.1.3 Philadelphia Chromosome (Ph+ / Ph-)
- 5.2 By Therapy
- 5.2.1 Chemotherapy
- 5.2.1.1 Hyper-CVAD
- 5.2.1.2 CALGB 8811
- 5.2.1.3 Linker
- 5.2.1.4 Nucleoside Inhibitors
- 5.2.2 Targeted Therapy
- 5.2.3 Radiation Therapy
- 5.2.4 Stem-Cell Transplantation
- 5.2.4.1 Autologous
- 5.2.4.2 Allogeneic
- 5.2.5 CAR-T / Cell Therapy
- 5.2.5.1 CD19
- 5.2.5.2 Next-Gen (Dual Antigen, Allogeneic)
- 5.2.1 Chemotherapy
- 5.3 By Age Group
- 5.3.1 Pediatrics (0-18 yrs)
- 5.3.2 Adults (19-64 yrs)
- 5.3.3 Geriatrics (>=65 yrs)
- 5.4 By Line of Therapy
- 5.4.1 First-Line
- 5.4.2 Second-Line
- 5.4.3 Relapsed / Refractory
- 5.5 By Route of Administration
- 5.5.1 Intravenous
- 5.5.2 Oral
- 5.6 Geography
- 5.6.1 North America
- 5.6.1.1 United States
- 5.6.1.2 Canada
- 5.6.1.3 Mexico
- 5.6.2 Europe
- 5.6.2.1 Germany
- 5.6.2.2 United Kingdom
- 5.6.2.3 France
- 5.6.2.4 Italy
- 5.6.2.5 Spain
- 5.6.2.6 Rest of Europe
- 5.6.3 Asia-Pacific
- 5.6.3.1 China
- 5.6.3.2 Japan
- 5.6.3.3 India
- 5.6.3.4 South Korea
- 5.6.3.5 Australia
- 5.6.3.6 Rest of Asia-Pacific
- 5.6.4 Middle East and Africa
- 5.6.4.1 GCC
- 5.6.4.2 South Africa
- 5.6.4.3 Rest of Middle East and Africa
- 5.6.5 South America
- 5.6.5.1 Brazil
- 5.6.5.2 Argentina
- 5.6.5.3 Rest of South America
- 5.6.1 North America
6 Competitive Landscape
- 6.1 Market Concentration
- 6.2 Strategic Moves
- 6.3 Market Share Analysis
- 6.4 Company profiles (includes Global level Overview, Market level overview, Core Segments, Financials as available, Strategic Information, Market Rank/Share for key companies, Products and Services, and Recent Developments)
- 6.4.1 Amgen Inc.
- 6.4.2 Jazz Pharmaceuticals
- 6.4.3 Novartis AG
- 6.4.4 Pfizer Inc.
- 6.4.5 F. Hoffmann-La Roche Ltd
- 6.4.6 Johnson & Johnson (Janssen)
- 6.4.7 Gilead Sciences (Kite Pharma)
- 6.4.8 Medac GmbH
- 6.4.9 Takeda Pharmaceutical Co.
- 6.4.10 Autolus Therapeutics plc
- 6.4.11 BeiGene Ltd.
- 6.4.12 Servier Group
- 6.4.13 Merck & Co. Inc.
- 6.4.14 AbbVie Inc.
- 6.4.15 Syndax Pharmaceuticals
- 6.4.16 Vironexis Biotherapeutics.
- 6.4.17 Ascentage Pharma
7 Market Opportunities and Future Outlook
- 7.1 White-space and Unmet-Need Assessment

