
PUBLISHER: Mordor Intelligence | PRODUCT CODE: 1836510

PUBLISHER: Mordor Intelligence | PRODUCT CODE: 1836510
Leukemia Therapeutics - Market Share Analysis, Industry Trends & Statistics, Growth Forecasts (2025 - 2030)
The leukemia treatment market generated USD 22.10 billion in 2025 and is on course to reach USD 31.09 billion by 2030, reflecting a 7.07% CAGR.
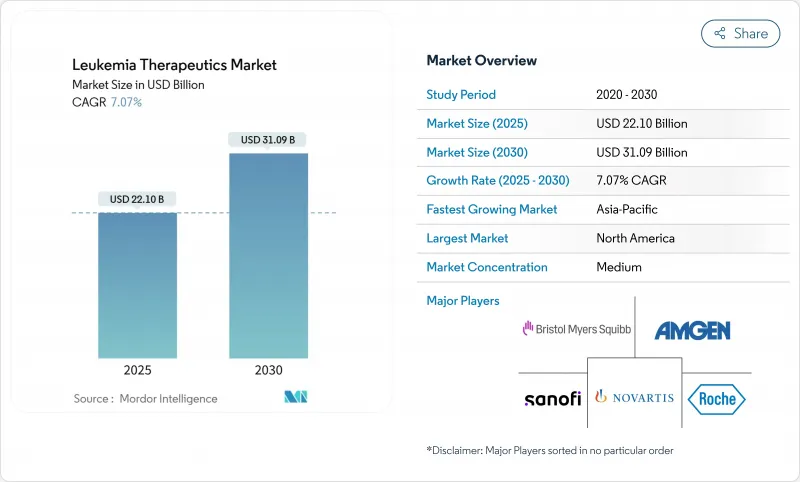
Growth is propelled by first-in-class immunotherapies such as the FDA-cleared menin inhibitor revumenib and an expanding roster of CAR-T products that repeatedly show deeper and more durable remissions than legacy regimens.Competitive intensity is rising as large pharmaceutical groups accelerate pipeline acquisitions and co-development deals to secure next-generation assets, while regional players in Asia develop price-disruptive CAR-T offerings that are one-tenth the cost of Western brands. Menin inhibitors, BTK antagonists and bispecific antibodies are widening therapeutic choice, while AI-driven drug repurposing and early genetic profiling are shrinking the time from discovery to first-in-human trials. Persistent supply-chain gaps for viral vectors and stringent reimbursement reviews temper the pace of adoption but have not derailed overall demand.
Global Leukemia Therapeutics Market Trends and Insights
Rising Burden of Leukemia
Global incidence continues to climb, with China alone reporting 531,000 patients in 2024-an increase of 12% over 2010-while mortality has edged down 5% thanks to broader therapy access. Demographic aging in high-income countries and improved diagnostic reach in emerging economies sustain a steady flow of new patients. The larger treatment-eligible population drives investment in precision drugs that offer chronic management as well as curative intent, ultimately cementing a stable demand base for the leukemia treatment market.
Advancement in Targeted & Immunotherapies
Menin inhibitors inaugurate a new drug class, highlighted by revumenib's 21% complete remission in KMT2A-rearranged disease. Simultaneously, CAR-T regimens combined with blinatumomab deliver 96% disease-free survival in pediatric acute lymphoblastic leukemia versus 88% for chemotherapy.These gains press competitors to shorten innovation cycles, reinforcing double-digit R&D outlays and spurring fresh licensing activity that enlarges the leukemia treatment market.
High Cost of Novel Therapeutics
Autologous CAR-T treatments list at USD 300,000-600,000 in the United States, placing significant strain on payer budgets and limiting uptake in low-income regions. Indian manufacturers have cut pricing to USD 30,000-50,000 through localized production, yet global parity remains distant. Elevated costs hinder immediate universal adoption, softening near-term expansion of the leukemia treatment market.
Other drivers and restraints analyzed in the detailed report include:
- Enhanced Early Detection & Patient Awareness
- Strategic Collaboration and R&D Investment
- Manufacturing Bottlenecks for Viral Vectors & Cell Therapies
For complete list of drivers and restraints, kindly check the Table Of Contents.
Segment Analysis
Targeted therapy retained a 33.76% slice of the leukemia treatment market in 2024, anchored by BTK and menin inhibitors. CAR-T cell therapy, while still smaller in absolute terms, is accelerating at 17.14% CAGR to 2030 on the back of label expansions and improved safety management. This trajectory reflects a gradual pivot away from broad-spectrum chemotherapy, creating fertile ground for combination trials that mix CAR-T with bispecifics or checkpoint inhibitors. Heightened demand for viral vectors and lymphodepletion agents accompanies this shift, cascading growth to suppliers across the leukemia treatment market.
Breakthroughs in conditioning regimens also strengthen stem-cell transplantation. The treosulfan-fludarabine pairing won FDA endorsement in early 2025 after demonstrating superior overall survival versus busulfan bases. Parallel advances in gene editing equip next-generation CAR-T constructs with dual-targeting capacity, promising broader efficacy and reduced relapse risk. Collectively, these dynamics cement CAR-T leadership for the second half of the decade.
Chronic lymphocytic leukemia (CLL) contributed 24.56% to leukemia treatment market size in 2024, supported by repeated BTK launches and venetoclax combos that extend progression-free survival. Acute lymphoblastic leukemia (ALL) stands out with a 10.36% CAGR, propelled by pediatric successes and the rollout of adult CAR-T indications. Acute myeloid leukemia (AML) growth is buoyed by menin inhibitors and venetoclax-based triplets, while chronic myeloid leukemia (CML) gains from Novartis's Scemblix, which offers a 20% superior molecular response over standard tyrosine kinase inhibitors.
Molecular sub-typing is redefining segmentation as NPM1-mutated and KMT2A-rearranged leukemias emerge as discrete commercial niches. Diagnostic precision enables smaller populations to attract bespoke therapies, creating more granular revenue channels while elevating the aggregate leukemia treatment market.
The Leukemia Therapeutics Market Report is Segmented by Treatment Type (Chemotherapy, Immunotherapy, and More), Leukemia Type (Acute Lymphocytic Leukemia, Acute Myeloid Leukemia, and More), Therapy Modality (Small-Molecule Drugs, Monoclonal Antibodies and More), Rpute of Administration(Oral, Intravenous and More), Age Group (Pediatric, Adults and More) and Geography. The Market Forecasts are Provided in Terms of Value (USD).
Geography Analysis
North America sustained 43.66% of global revenue in 2024, powered by early adoption, deep reimbursement pools and robust clinical infrastructure. Accelerated approval pathways compress launch timelines, although periodic chemotherapy shortages underscore supply-chain fragility. The region remains the vanguard for CAR-T and gene-edited solutions, ensuring continued leadership of the leukemia treatment market.
Asia-Pacific records the fastest 9.56% CAGR through 2030. India's USD 30,000-50,000 domestic CAR-T therapies broaden eligibility and foreshadow wider affordability breakthroughs. Japan's green lights for Ezharmia and acalabrutinib, and China's improving survival rates despite incidence growth, add momentum. Local manufacturing hubs and government-backed reimbursement pilots shrink access gaps, expanding the leukemia treatment market.
Europe posts steady single-digit gains, aided by harmonized EMA review timelines and pan-regional early-access programs. South America and the Middle East & Africa trail due to resource constraints and cold-chain hurdles. Nonetheless, modular point-of-care production units and temperature-stable formulations promise to unlock latent demand over the next decade, advancing the global footprint of the leukemia treatment market.
- Amgen
- AstraZeneca
- Bristol-Myers Squibb
- Roche
- Incyte
- Johnson & Johnson
- Novartis
- Pfizer
- Sanofi
- Teva Pharmaceutical Industries
- Astellas Pharma
- Otsuka
- BeiGene Ltd.
- Gilead Sciences
- Abbvie
- Takeda Pharmaceuticals
- GlaxoSmithKline
- Bluebird bio, Inc.
- Jazz Pharmaceuticals plc
- Kura Oncology, Inc.
- Ascentage Pharma
- Servier Pharmaceuticals
- Bayer
- Sun Pharma Industries Ltd.
Additional Benefits:
- The market estimate (ME) sheet in Excel format
- 3 months of analyst support
TABLE OF CONTENTS
1 Introduction
- 1.1 Study Assumptions and Market Definition
- 1.2 Scope of the Study
2 Research Methodology
3 Executive Summary
4 Market Landscape
- 4.1 Market Overview
- 4.2 Market Drivers
- 4.2.1 Rising Burden Of Leukemia
- 4.2.2 Advancement in Targeted & Immunotherapies
- 4.2.3 Enhanced Early Detection & Patient Awareness
- 4.2.4 Strategic Collaboration and R&D Investment
- 4.2.5 Adoption of Combinational Therapy Regimens
- 4.2.6 AI-Driven Drug Repurposing Accelerates Pipeline
- 4.3 Market Restraints
- 4.3.1 High Cost Of Novel Therapeutics
- 4.3.2 Stringent Regulatory & Reimbursement Hurdles
- 4.3.3 Manufacturing Bottlenecks For Viral Vectors & Cell Therapies
- 4.3.4 Cold-Chain Logistics Limit Access In LMICs
- 4.4 Value / Supply-Chain Analysis
- 4.5 Regulatory Landscape
- 4.6 Technology Outlook
- 4.7 Porter's Five Forces Analysis
- 4.7.1 Bargaining Power of Suppliers
- 4.7.2 Bargaining Power of Buyers
- 4.7.3 Threat of New Entrants
- 4.7.4 Threat of Substitutes
- 4.7.5 Intensity of Competitive Rivalry
5 Market Size and Growth Forecasts (Value-USD)
- 5.1 By Treatment Type
- 5.1.1 Chemotherapy
- 5.1.2 Immunotherapy
- 5.1.3 Targeted Therapy
- 5.1.4 CAR-T Cell Therapy
- 5.1.5 Gene Therapy
- 5.1.6 Stem Cell Transplantation
- 5.1.7 Other Treatment Types
- 5.2 By Leukemia Type
- 5.2.1 Acute Lymphoblastic Leukemia
- 5.2.2 Acute Myeloid Leukemia
- 5.2.3 Chronic Lymphocytic Leukemia
- 5.2.4 Chronic Myeloid Leukemia
- 5.2.5 Other Leukemia Types
- 5.3 By Therapy Modality
- 5.3.1 Small-Molecule Drugs
- 5.3.2 Monoclonal Antibodies
- 5.3.3 CAR-T Cell Therapies
- 5.3.4 Gene Therapies
- 5.3.5 Bispecific Antibodies
- 5.3.6 RNA-based Therapies
- 5.3.7 Other Modalities
- 5.4 By Route of Administration
- 5.4.1 Oral
- 5.4.2 Intravenous
- 5.4.3 Subcutaneous
- 5.4.4 Other Routes
- 5.5 By Age Group
- 5.5.1 Pediatric (<14 yrs)
- 5.5.2 Adult (15-64 yrs)
- 5.5.3 Geriatric (65+ yrs)
- 5.6 By Geography
- 5.6.1 North America
- 5.6.1.1 United States
- 5.6.1.2 Canada
- 5.6.1.3 Mexico
- 5.6.2 Europe
- 5.6.2.1 Germany
- 5.6.2.2 United Kingdom
- 5.6.2.3 France
- 5.6.2.4 Italy
- 5.6.2.5 Spain
- 5.6.2.6 Rest of Europe
- 5.6.3 Asia-Pacific
- 5.6.3.1 China
- 5.6.3.2 Japan
- 5.6.3.3 India
- 5.6.3.4 Australia
- 5.6.3.5 South Korea
- 5.6.3.6 Rest of Asia-Pacific
- 5.6.4 Middle East and Africa
- 5.6.4.1 GCC
- 5.6.4.2 South Africa
- 5.6.4.3 Rest of Middle East and Africa
- 5.6.5 South America
- 5.6.5.1 Brazil
- 5.6.5.2 Argentina
- 5.6.5.3 Rest of South America
- 5.6.1 North America
6 Competitive Landscape
- 6.1 Market Concentration
- 6.2 Market Share Analysis
- 6.3 Company profiles (includes Global level Overview, Market level overview, Core Segments, Financials as available, Strategic Information, Market Rank/Share for key companies, Products and Services, and Recent Developments)
- 6.3.1 Amgen Inc.
- 6.3.2 AstraZeneca plc
- 6.3.3 Bristol-Myers Squibb Co.
- 6.3.4 F. Hoffmann-La Roche Ltd.
- 6.3.5 Incyte Corporation
- 6.3.6 Johnson & Johnson
- 6.3.7 Novartis International AG
- 6.3.8 Pfizer Inc.
- 6.3.9 Sanofi S.A.
- 6.3.10 Teva Pharmaceutical Industries Ltd.
- 6.3.11 Astellas Pharma Inc.
- 6.3.12 Otsuka Holdings Co., Ltd.
- 6.3.13 BeiGene Ltd.
- 6.3.14 Gilead Sciences, Inc. (Kite Pharma)
- 6.3.15 AbbVie Inc.
- 6.3.16 Takeda Pharmaceutical Co. Ltd.
- 6.3.17 GlaxoSmithKline plc
- 6.3.18 Bluebird bio, Inc.
- 6.3.19 Jazz Pharmaceuticals plc
- 6.3.20 Kura Oncology, Inc.
- 6.3.21 Ascentage Pharma
- 6.3.22 Servier Pharmaceuticals
- 6.3.23 Bayer AG
- 6.3.24 Sun Pharma Industries Ltd.
7 Market Opportunities and Future Outlook
- 7.1 White-Space and Unmet-Need Assessment

