
PUBLISHER: Mordor Intelligence | PRODUCT CODE: 1842713

PUBLISHER: Mordor Intelligence | PRODUCT CODE: 1842713
United States Property And Casualty Insurance - Market Share Analysis, Industry Trends & Statistics, Growth Forecasts (2025 - 2030)
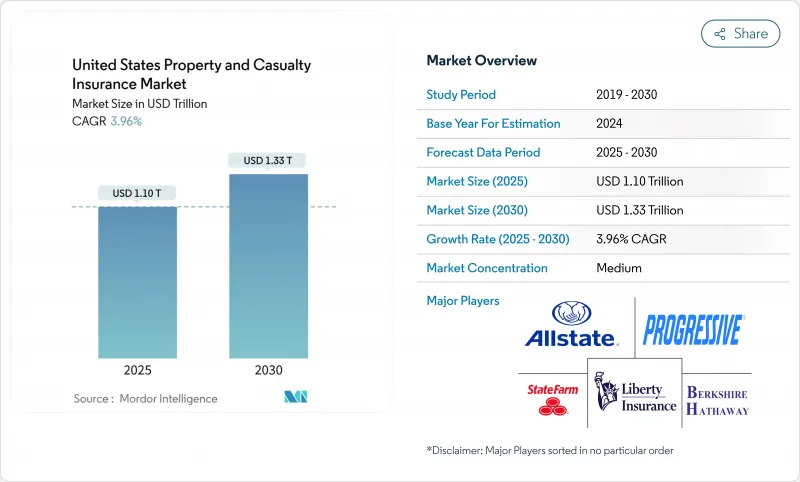
The United States property and casualty insurance market was valued at USD 1.10 trillion in 2025 and is projected to reach USD 1.33 trillion by 2030, growing at a 3.96% CAGR.
Premium growth is chiefly a function of inflation-linked rate actions, with players focusing on margin preservation rather than pure volume expansion. A decisive return to underwriting profitability produced a gain in 2024 after a significant loss in 2023, underscoring the sector's resilience. Technology investments in telematics, artificial intelligence, and embedded distribution models are reshaping pricing accuracy and customer acquisition strategies. Meanwhile, higher fixed-income yields widen investment spreads, giving insurers extra tolerance for near-term underwriting volatility. Competitive intensity is rising as the largest players leverage scale and data analytics to consolidate share, particularly within auto lines where telematics-based rating is now mainstream.
United States Property And Casualty Insurance Market Trends and Insights
Heightened Inflation-Linked Premium Growth
Property insurance rates moved sharply higher in 2024 as insurers sought to align pricing with surging replacement-cost inflation, driving double-digit increases in catastrophe-exposed regions. Players leaned on real-time rating engines that adjust for commodity and labor inputs, creating a spread between preferred and distressed risks. The strategy strengthened underwriting margins and accelerated premium recognition while limiting new-business volumes. Customers with strong risk profiles benefited from modest adjustments, whereas challenged classes faced rapid escalation, reshaping acquisition tactics across the property and casualty insurance market. Ongoing building-cost inflation suggests that rate discipline will remain central to earnings stability through 2026.
Surging Telematics and UBI Adoption
Progressive disclosed that more than 60% of new auto policies now include telematics participation, signaling mainstream acceptance of usage-based insurance. Behavioral data enables granular segmentation, lowering loss ratios and permitting competitive pricing for low-risk drivers. Berkshire Hathaway reported growth in auto underwriting profit, attributing the gain to data-driven risk selection and individualized pricing. Machine-learning fraud analytics further trim claim leakage, saving players 15-20% on suspicious losses. As telematics spreads into commercial fleets, premium volume in the property and casualty insurance market is expected to follow miles driven rather than static vehicle counts, changing forecasting models for auto segments.
Escalating Catastrophe Losses & Reinsurance Costs
Insured natural-disaster losses touched USD 154 billion globally in 2024, with California wildfires alone accounting for up to USD 40 billion. Reinsurance treaty renewals reflected 15-25% rate hikes for catastrophe-exposed programs, compelling primary insurers either to cede more risk or pass higher costs to policyholders. The California FAIR Plan now carries USD 458 billion of exposure against USD 200 million of surplus, illustrating systemic stress in residual markets. Elevated catastrophe frequency is pressuring the property and casualty insurance market to adopt real-time modeling and dynamic pricing to maintain solvency margins.
Other drivers and restraints analyzed in the detailed report include:
- Fed-Rate Tailwinds Boosting Investment Income
- AI-Led Underwriting and Claims Efficiency Gains
- Nuclear-Verdict Driven Social Inflation
For complete list of drivers and restraints, kindly check the Table Of Contents.
Segment Analysis
Commercial auto generated 45.63% of 2024 direct premiums, anchoring the property and casualty insurance market through mandatory coverage requirements and escalating freight activity. Telematics-enabled fleets provide a data-rich environment that supports individualized pricing, restraining loss-ratio deterioration in a segment historically plagued by severity inflation. Specialty lines such as cyber, marine, inland, and surety are forecast to grow at a 5.60% CAGR through 2030 as businesses confront new digital and supply-chain risks. The property and casualty insurance market size for specialty products is expected to broaden meaningfully as federal infrastructure spending drives surety-bond demand.
Homeowners writers are curbing catastrophe-prone exposure, while private passenger auto faces parts-inflation headwinds that squeeze underwriting margins. Workers' compensation continues its profitable run with a seventh consecutive combined ratio below 90% in 2024. Liability lines struggle under social-inflation pressure, pushing rate increases into the high single digits as players defend reserve strength. Surety growth is amplified by the USD 1.2 trillion Infrastructure Investment and Jobs Act, which requires performance guarantees on federally funded projects and expands the property and casualty insurance market share for bond specialists.
The United States Property and Casualty Insurance Market is Segmented by Insurance Line (Homeowner, Private Passenger Auto, Commercial Auto, General Liability, and More), Distribution Channel (Direct, Agents, Brokers, Bancassurance, and More), Customer Segment (Personal Lines, Small Commercial, Mid-Market Commercial and More), and Region (California, Texas and More). The Market Forecasts are Provided in Terms of Value (USD)
List of Companies Covered in this Report:
- State Farm Mutual Automobile Insurance Co.
- Berkshire Hathaway Inc. (GEICO, National Indemnity)
- The Progressive Corp.
- Allstate Corp.
- Liberty Mutual Holding Co.
- USAA
- Travelers Cos. Inc.
- Chubb Ltd.
- Nationwide Mutual Insurance Co.
- American International Group Inc.
- Farmers Insurance Group
- Hartford Financial Services Group
- CNA Financial Corp.
- W. R. Berkley Corp.
- American Family Insurance Group
- Old Republic International Corp.
- Tokio Marine (HCC)
- Markel Group Inc.
- Fairfax Financial Holdings Ltd. (Crum & Forster)
- Zurich North America
- Arch Capital Group Ltd.
Additional Benefits:
- The market estimate (ME) sheet in Excel format
- 3 months of analyst support
TABLE OF CONTENTS
1 Introduction
- 1.1 Study Assumptions & Market Definition
- 1.2 Scope of the Study
2 Research Methodology
3 Executive Summary
4 Market Landscape
- 4.1 Market Overview
- 4.2 Market Drivers
- 4.2.1 Heightened inflation-linked premium growth
- 4.2.2 Surging telematics & UBI adoption
- 4.2.3 Fed-rate tailwinds boosting investment income
- 4.2.4 AI-led underwriting & claims efficiency gains
- 4.2.5 Embedded insurance partnerships with OEMs
- 4.2.6 Rising cyber-liability demand among enterprises & SMEs
- 4.3 Market Restraints
- 4.3.1 Escalating catastrophe losses & reinsurance costs
- 4.3.2 Reserve-adequacy & loss-cost inflation pressure
- 4.3.3 Nuclear-verdict driven social inflation
- 4.3.4 Increasing frequency of secondary perils (e.g., convective storms, wildfires, urban flooding)
- 4.4 Value / Supply-Chain Analysis
- 4.5 Regulatory Landscape
- 4.6 Technological Outlook
- 4.7 Porter's Five Forces
- 4.7.1 Threat of New Entrants
- 4.7.2 Bargaining Power of Buyers
- 4.7.3 Bargaining Power of Suppliers
- 4.7.4 Threat of Substitutes
- 4.7.5 Intensity of Competitive Rivalry
- 4.8 Climate-Risk Impact Analysis
5 Market Size & Growth Forecasts (Value, USD bn)
- 5.1 By Insurance Line
- 5.1.1 Homeowners
- 5.1.2 Private Passenger Auto
- 5.1.3 Commercial Auto
- 5.1.4 Commercial Property
- 5.1.5 Workers' Compensation
- 5.1.6 General Liability
- 5.1.7 Specialty (Cyber, Marine, Inland, Surety)
- 5.2 By Distribution Channel
- 5.2.1 Direct
- 5.2.2 Independent Agents / Brokers
- 5.2.3 Captive Agents
- 5.2.4 Bancassurance
- 5.2.5 Digital / Insurtech Platforms
- 5.2.6 Wholesale / MGAs
- 5.3 By Customer Segment
- 5.3.1 Personal Lines
- 5.3.2 Small Commercial (SME)
- 5.3.3 Middle-Market Commercial
- 5.3.4 Large Commercial & Specialty
- 5.4 By Region
- 5.4.1 California
- 5.4.2 Texas
- 5.4.3 Florida
- 5.4.4 New York
- 5.4.5 Others
6 Competitive Landscape
- 6.1 Market Concentration
- 6.2 Strategic Moves
- 6.3 Market Share Analysis
- 6.4 Company Profiles {(includes Global level Overview, Market level overview, Core Segments, Financials as available, Strategic Information, Market Rank/Share for key companies, Products & Services, and Recent Developments)}
- 6.4.1 State Farm Mutual Automobile Insurance Co.
- 6.4.2 Berkshire Hathaway Inc. (GEICO, National Indemnity)
- 6.4.3 The Progressive Corp.
- 6.4.4 Allstate Corp.
- 6.4.5 Liberty Mutual Holding Co.
- 6.4.6 USAA
- 6.4.7 Travelers Cos. Inc.
- 6.4.8 Chubb Ltd.
- 6.4.9 Nationwide Mutual Insurance Co.
- 6.4.10 American International Group Inc.
- 6.4.11 Farmers Insurance Group
- 6.4.12 Hartford Financial Services Group
- 6.4.13 CNA Financial Corp.
- 6.4.14 W. R. Berkley Corp.
- 6.4.15 American Family Insurance Group
- 6.4.16 Old Republic International Corp.
- 6.4.17 Tokio Marine (HCC)
- 6.4.18 Markel Group Inc.
- 6.4.19 Fairfax Financial Holdings Ltd. (Crum & Forster)
- 6.4.20 Zurich North America
- 6.4.21 Arch Capital Group Ltd.
7 Market Opportunities & Future Outlook
- 7.1 White-Space & Unmet-Need Assessment

