
PUBLISHER: Mordor Intelligence | PRODUCT CODE: 1844606

PUBLISHER: Mordor Intelligence | PRODUCT CODE: 1844606
Water Treatment Chemicals - Market Share Analysis, Industry Trends & Statistics, Growth Forecasts (2025 - 2030)
The Water Treatment Chemicals Market size is estimated at USD 40.51 billion in 2025, and is expected to reach USD 53.35 billion by 2030, at a CAGR of 5.66% during the forecast period (2025-2030).
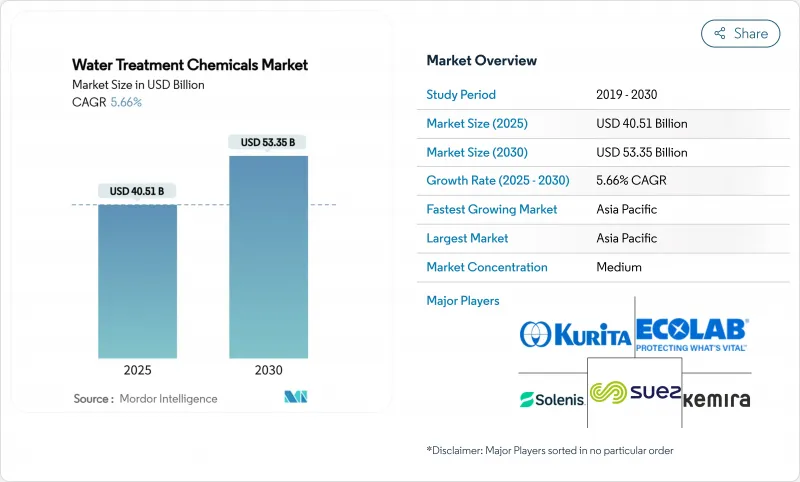
Growth is underpinned by intensifying water scarcity, stricter discharge norms, and the spread of zero-liquid-discharge requirements across heavy industries. AI-driven dosing platforms are reshaping operational practices by curbing chemical wastage while improving plant compliance, especially against emerging contaminants such as PFAS. Asia Pacific sets the pace both in scale and growth, underpinned by rapid industrialization and sizable public investment in treatment infrastructure. Demand also accelerates in high-purity applications for semiconductors and pharmaceuticals, where ultra-tight quality targets drive specialized chemical usage. Consolidation among leading suppliers is producing broader product portfolios, while bio-based formulations and digital service models emerge as decisive differentiators in an increasingly sustainability-conscious market landscape.
Global Water Treatment Chemicals Market Trends and Insights
Rising Contamination of Surface & Ground Water Sources
Increasing loads of microplastics and pharmaceutical residues are heightening treatment complexity and boosting chemical demand. Academic studies show conventional treatment removes only 50-70% of microplastics, pushing utilities toward advanced coagulation-flocculation regimes that escalate chemical consumption by 15-25%. Rapid industrialization compounds the issue: an estimated 80% of industrial effluent in emerging economies still enters waterways untreated, forcing utilities to adopt multi-barrier processes. Combining optimized polymer blends with strategic source-water mixing can trim costs up to 40% while raising removal efficiency, underscoring the value of innovative formulations. This driver exerts its strongest pull across Asia Pacific and Africa, where urban expansion intersects with limited legacy infrastructure and degraded watersheds. Over the medium term, escalating contamination is set to keep coagulant and adsorbent volumes on an upward trajectory, reinforcing the water treatment chemicals market growth momentum.
Tightening Discharge Norms for Heavy Metals & Nutrients
Stringent regulatory changes are reshaping chemical specifications globally. The United States set unprecedented 4 ppt MCLs for PFOA and PFOS in 2024, affecting roughly 100 million residents and compelling utilities to adopt specialized adsorbents and ion-exchange resins. Similar pressure arises in Europe and parts of Asia as authorities lower heavy-metal limits and broaden nutrient caps. Suppliers have responded with resins such as LANXESS Lewatit MDS TP 108, offering double the operational life of earlier products. Although the U.S. compliance timeline now extends to 2031, standards remain strict, ensuring sustained demand for high-performance chemistries. In parallel, the 2024 update to steam-electric effluent rules introduced zero-discharge obligations for flue-gas desulfurization wastewater, intensifying chemical requirements in the power sector. Short-term impact is pronounced in mature economies, but ripple effects extend globally as multinationals harmonize internal water-quality protocols.
Persistent Non-compliance & Weak Enforcement in Low-income Regions
Regulatory compliance gaps in several low-income economies inhibit uptake of advanced formulations. The United Nations reports that 42% of global household wastewater still remains untreated, with even lower treatment rates for industrial discharges. Limited monitoring budgets and fragmented enforcement encourage cheaper, lower-efficacy chemicals, shrinking accessible demand for premium products. This disparity forces suppliers to craft tiered offerings that balance affordability with minimum performance. Long-term growth is curbed until supervisory capacities improve, particularly across sub-Saharan Africa and certain South-Asian basins where compliance remains voluntary rather than mandatory. Nevertheless, donor-funded infrastructure projects and export-driven manufacturing in these regions may gradually elevate enforcement expectations.
Other drivers and restraints analyzed in the detailed report include:
- Industrial Zero-Liquid-Discharge Mandates in Power & Mining
- AI-driven Real-time Dosing & Remote Asset Optimization Boosting Chemical Intensity
- Volatile Raw-material Prices for Specialty Polymers & Biocides
For complete list of drivers and restraints, kindly check the Table Of Contents.
Segment Analysis
Coagulants and flocculants held a 38% share of the water treatment chemicals market in 2024 and are projected to expand at a 5.99% CAGR to 2030. The segment's scale stems from its foundational function of removing turbidity in both municipal and industrial circuits. Aluminum-based coagulants such as PAC achieve turbidity reductions exceeding 90%, while optimized dosing lowers sludge generation, a pivotal operating cost lever. In parallel, iron salts blended with biodegradable polymers show comparable performance, opening pathways for sludge valorization and lower disposal fees.
R&D focus is shifting toward bio-derived components-plant-based tannins, starch graft copolymers, and fungal chitosan-that meet tighter sludge-toxicity norms. Several utilities in Scandinavia now trial bark-derived coagulants that reduce sludge volume by 50% and carry a lower carbon footprint. Suppliers are scaling up to industrial volumes, positioning green coagulants as premium substitutes rather than budget options. The resulting uplift in average selling price partially offsets the raw-material inflation faced by traditional aluminum salts, preserving margins and broadening adoption prospects across high-compliance regions.
Municipal utilities captured 35% of the water treatment chemicals market share in 2024, reflecting the ongoing need to safeguard public health amid aging distribution assets. Population growth and regulatory tightening, especially on PFAS, ensure steady baseline demand. Utilities pursuing 1-log improvements in pathogen removal rely on blended oxidants and corrosion inhibitors to maintain residual levels across extended pipe networks.
The semiconductor segment is slated to grow at 7.10% CAGR, outpacing other industrial verticals. Advanced node fabs consume up to 10 million gal/day of ultra-pure water, mandating ion-exchange resins and polishing chemicals with parts-per-trillion purity targets. Expansion of fabrication capacity in Taiwan, South Korea, and the United States feeds resilient chemical demand through the decade. Elsewhere, coal-fired power plants, oil & gas refineries, and diversified manufacturers maintain sizeable consumption, though growth is tempered by energy-transition policy uncertainty and process-intensification strategies that aim to lower specific water intake.
The Water Treatment Chemicals Market is Segmented by Product Type (Coagulants and Flocculants, Defoamer and Defoaming Agent, Oxygen Scavengers, and More), End-User Industry (Power Generation, Oil and Gas, and More), Application (Boiler Water Treatment, Cooling Water Treatment, and More), Treatment Stage (Primary, Secondary, and More), and Geography (Asia-Pacific, North America, Europe, South America, Middle East and Africa).
Geography Analysis
Asia Pacific anchored 47% of the global revenue in 2024 and is poised to expand at 7.23% CAGR through 2030, cementing its dual status as largest and fastest-growing water treatment chemicals market. China remains pivotal; 90.4% of monitored surface water met quality Class III or better in 2024, yet rising industrial discharge keeps chemical demand elevated. Underground wastewater treatment plant rollouts equipped with membrane bioreactors amplify chemical intensity, while India's Production-Linked Incentives accelerate local supply chains for core products. Developed economies such as Japan and South Korea sustain high per-capita consumption driven by electronics and pharmaceutical clusters.
North America follows as a mature yet dynamic region. The EPA's 2024 PFAS rule compels nearly 10,000 water utilities to adopt granular activated carbon and ion-exchange treatments, lifting specialty chemical volumes. Major contracts, exemplified by Calgon Carbon's deal with American Water across 10 states, illustrate the market response. Desalination activity in the U.S. Southwest and Mexico, paired with industrial ZLD in oilfield operations, adds incremental growth.
Europe demonstrates steady expansion underpinned by circular-economy directives. The 2024 CEN workshop agreement on brine valorization promotes chemical recovery from desalination concentrates, fostering demand for selective precipitants and adsorbents. Stringent nutrient caps in the Baltic and North Seas bolster sales of low-phosphorus corrosion inhibitors and nitrate removal resins. Meanwhile, Middle East and Africa record divergent trends: GCC projects accelerate under Vision 2030 frameworks, whereas enforcement deficits in parts of sub-Saharan Africa limit premium uptake. Latin America sits mid-range, with Brazil's sanitation law reforms starting to unlock municipal spending, yet currency volatility tempers short-term procurement.
- Aditya Birla
- AECI Water
- Albemarle
- Baker Hughes
- BASF SE
- Buckman
- Chemtrade Logistics
- ChemTreat
- Dow
- DuPont
- Ecolab
- Genesys
- Ion Exchange (India)
- Kemira
- Kurita Water Industries
- Lanxess
- Nouryon
- SNF
- Solenis
- Solvay
- Sudoc
- SUEZ
- Thermax
- USALCO
- Veolia
- Watch Water
Additional Benefits:
- The market estimate (ME) sheet in Excel format
- 3 months of analyst support
TABLE OF CONTENTS
1 Introduction
- 1.1 Study Assumptions and Market Definition
- 1.2 Scope of the Study
2 Research Methodology
3 Executive Summary
4 Market Landscape
- 4.1 Market Overview
- 4.2 Market Drivers
- 4.2.1 Rising contamination of surface and ground-water sources
- 4.2.2 Tightening discharge norms for heavy metals and nutrients
- 4.2.3 Industrial zero-liquid-discharge (ZLD) mandates in power and mining
- 4.2.4 Municipal infrastructure stimulus in Asia pacific and GCC Countries
- 4.2.5 AI-driven real-time dosing and remote asset optimisation boosting chemical intensity
- 4.3 Market Restraints
- 4.3.1 Persistent non-compliance and weak enforcement in low-income regions
- 4.3.2 Volatile raw-material prices for specialty polymers and biocides
- 4.3.3 Membrane and electro-oxidation solutions reducing chemical demand
- 4.4 Value -Chain Analysis
- 4.5 Porter's Five Forces
- 4.5.1 Bargaining Power of Suppliers
- 4.5.2 Bargaining Power of Buyers
- 4.5.3 Threat of New Entrants
- 4.5.4 Threat of Substitutes
- 4.5.5 Competitive Rivalry
5 Market Size and Growth Forecasts (Value)
- 5.1 By Product Type
- 5.1.1 Coagulants and Flocculants
- 5.1.2 Defoamer and Defoaming Agent (Antifoams)
- 5.1.3 Oxygen Scavengers
- 5.1.4 Corrosion Inhibitors
- 5.1.5 Biocide and Disinfectants
- 5.1.6 Oxidants
- 5.1.7 PH Conditioners/Adjuster
- 5.1.8 Sludge Conditioners
- 5.1.9 Scale Inhibitors
- 5.1.10 Organic Chemicals/Odor Removal (Activated Carbon)
- 5.1.11 Other Product Types
- 5.2 By End-user Industry
- 5.2.1 Power Generation
- 5.2.2 Oil and Gas
- 5.2.3 Chemical Manufacturing
- 5.2.4 Mining and Mineral Processing
- 5.2.5 Municipal Water and Wastewater Utilities
- 5.2.6 Food and Beverage
- 5.2.7 Pulp and Paper
- 5.2.8 Metals and Steel
- 5.2.9 Semiconductor and Electronics
- 5.2.10 Others (Pharmaceuticals and Life-Sciences)
- 5.3 By Application
- 5.3.1 Boiler Water Treatment
- 5.3.2 Cooling Water Treatment
- 5.3.3 Raw Water/Intake Clarification
- 5.3.4 Wastewater/Effluent Treatment
- 5.3.5 Desalination and RO Pre-treatment
- 5.3.6 Ultra-pure/High-Purity Water
- 5.4 By Treatment Stage
- 5.4.1 Primary (Coagulation-Flocculation)
- 5.4.2 Secondary (Biological Adjunct Chemicals)
- 5.4.3 Tertiary and Advanced (AOPs, Disinfection)
- 5.4.4 Sludge Handling and Conditioning
- 5.5 By Geography
- 5.5.1 Asia-Pacific
- 5.5.1.1 China
- 5.5.1.2 India
- 5.5.1.3 Japan
- 5.5.1.4 South Korea
- 5.5.1.5 ASEAN Countries
- 5.5.1.6 Rest of Asia-Pacific
- 5.5.2 North America
- 5.5.2.1 United States
- 5.5.2.2 Canada
- 5.5.2.3 Mexico
- 5.5.3 Europe
- 5.5.3.1 Germany
- 5.5.3.2 United Kingdom
- 5.5.3.3 France
- 5.5.3.4 Italy
- 5.5.3.5 Russia
- 5.5.3.6 Scandinavia
- 5.5.3.7 Rest of Europe
- 5.5.4 South America
- 5.5.4.1 Brazil
- 5.5.4.2 Argentina
- 5.5.4.3 Rest of South America
- 5.5.5 Middle East and Africa
- 5.5.5.1 Saudi Arabia
- 5.5.5.2 United Arab Emirates
- 5.5.5.3 Qatar
- 5.5.5.4 Nigeria
- 5.5.5.5 South Africa
- 5.5.5.6 Rest of Middle East and Africa
- 5.5.1 Asia-Pacific
6 Competitive Landscape
- 6.1 Market Concentration
- 6.2 Strategic Moves
- 6.3 Market Share Analysis
- 6.4 Company Profiles (includes Global level Overview, Market level overview, Core Segments, Financials as available, Strategic Information, Market Rank/Share for key companies, Products and Services, and Recent Developments)
- 6.4.1 Aditya Birla
- 6.4.2 AECI Water
- 6.4.3 Albemarle
- 6.4.4 Baker Hughes
- 6.4.5 BASF SE
- 6.4.6 Buckman
- 6.4.7 Chemtrade Logistics
- 6.4.8 ChemTreat
- 6.4.9 Dow
- 6.4.10 DuPont
- 6.4.11 Ecolab
- 6.4.12 Genesys
- 6.4.13 Ion Exchange (India)
- 6.4.14 Kemira
- 6.4.15 Kurita Water Industries
- 6.4.16 Lanxess
- 6.4.17 Nouryon
- 6.4.18 SNF
- 6.4.19 Solenis
- 6.4.20 Solvay
- 6.4.21 Sudoc
- 6.4.22 SUEZ
- 6.4.23 Thermax
- 6.4.24 USALCO
- 6.4.25 Veolia
- 6.4.26 Watch Water
7 Market Opportunities and Future Outlook
- 7.1 White-space and Unmet-need Assessment

