
PUBLISHER: Mordor Intelligence | PRODUCT CODE: 1848017

PUBLISHER: Mordor Intelligence | PRODUCT CODE: 1848017
United States Tractor - Market Share Analysis, Industry Trends & Statistics, Growth Forecasts (2025 - 2030)
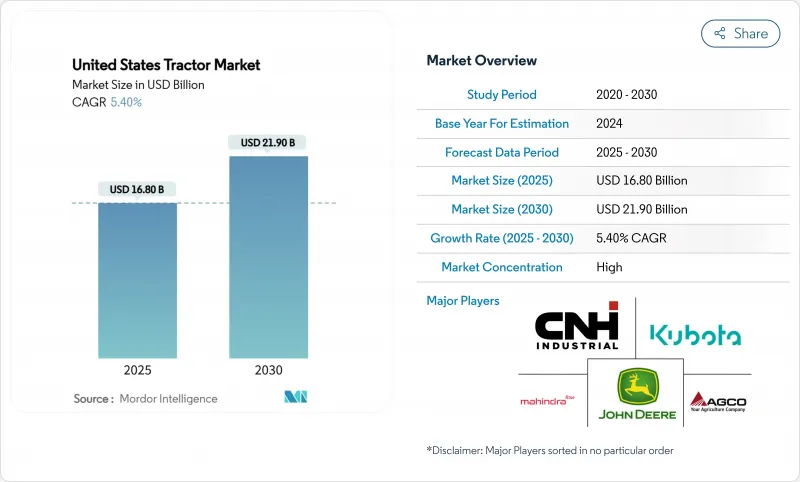
The United States tractor market size is valued at USD 16.8 billion in 2025 and is projected to reach USD 21.9 billion by 2030, registering a 5.4% CAGR during the forecast period.
Strong replacement demand, rapid electrification below 40 HP, and embedded autonomy are shaping the United States tractor market as growers look to offset rising labor costs and compliance spending. Real-time telematics, Farm Bill incentives, and carbon-credit monetization together lift return on investment, even as Tier-4 final engine costs add headwinds. Competitive behavior remains intense because the top five vendors control 89.6% of the United States tractor market, reinforcing price discipline while accelerating feature roll-outs. The interplay of regulation, connectivity gaps, and dealership consolidation signals a pivot toward integrated technology packages that promise quantifiable savings across multiple crop cycles.
United States Tractor Market Trends and Insights
Continuous Electrification of Sub-100 HP Models
Battery-powered tractors below 40 HP now offer meaningful payback because operating cost reductions offset up-front premiums within three to six seasons. John Deere's E-Power prototypes and Solectrac's compact lineup underline how early volume is clustering in vineyards, dairies, and greenhouse operations where low noise and zero tailpipe emissions carry premium value. Battery density still limits larger units, concentrating R&D on the compact range, yet component prices have fallen 14% since 2023, narrowing diesel price advantages. Dealer education and charging-infrastructure incentives remain gating factors, but Farm Bill climate allocations are catalyzing pilot deployments. With Deere's commercial rollout slated for 2026, rivals face a shrinking window to lock in early adopters.
Smart-Implement Compatibility Boosts Replacement Demand
Implement purposely limit on backward compatibility, pressing farmers to trade in 6-8-year-old tractors rather than the historic 11-year cycle. The surge is most visible in the 40-100 HP class, where row-crop operations depend on sectional control. Consequently, the Original Equipment Manufacturers (OEMs) bundle guidance-ready wiring harnesses as standard to capture replacement share. This tailwind should peak by 2027 once the installed base reaches critical mass.
High Upfront and Maintenance Costs of Tier-4 Final Engines
Tier-4 final compliance lifts sticker prices by more than 15% and introduces exhaust fluid expenses that erode margins for family farms. While emissions of particulate matter plunge 95%, the payback period lengthens, motivating many growers to buy used pre-Tier-4 units or delay replacements. The strain is likely to moderate after 2026 once component suppliers scale production and secondary-market prices normalize.
Other drivers and restraints analyzed in the detailed report include:
- Advanced Telematics Lower Total Cost of Ownership
- Precision-Ag Incentives in the 2023 U.S. Farm Bill
- Fragmented Dealership Coverage in Mountain States
For complete list of drivers and restraints, kindly check the Table Of Contents.
Segment Analysis
The below 40 HP electric tractor is forecast to advance at 10.8% CAGR, outpacing the broader United States tractor market by nearly twofold, due to falling battery costs and municipal incentives. This segment benefits from greenhouse, dairy, and urban farming operations that prize zero-emission, low-noise performance. The 40-100 HP range retains 51% United States tractor market share in 2024 because of its versatility across row-crop and livestock tasks, anchoring long-term volume. Above 100 HP units serve large farms where diesel energy density still delivers the lowest dollar-per-acre cost.
Electric newcomers target cost-of-ownership metrics rather than environmental altruism, citing 60% fuel savings and 40% lower maintenance. Deere & Company's 130 HP E-Power prototype underscores the manufacturer's shift toward scalable electrification, though battery mass keeps large-frame adoption in pilot mode. Solectrac's revenue rose from USD 1.8 million in 2021 to USD 11 million in 2022, yet net losses show infrastructure hurdles remain. As lithium iron phosphate chemistry gains traction, pack costs could fall 20% by 2027, narrowing diesel's upfront advantage.
The utility tractors captured 41% of 2024 shipments, reflecting broad task compatibility across cattle, hay, and property maintenance. Still, orchard and vineyard tractors are set for an 11.4% CAGR through 2030, eclipsing the United States tractor market average. Their premium pricing stems from narrow chassis, autonomy-ready controls, and zero-emission powertrains that thrive in confined rows. Row-crop tractors hold stable demand linked to corn and soybean acreage, but margin pressure is steeper as OEMs balance high-horsepower features against price-sensitive growers.
Case IH's FieldOps platform and its Connectivity Included offer removes data-service fees for new orchard tractors, trimming lifetime costs and spurring adoption. Premium fruit growers in California pay up because the margin per acre dwarfs commodity crops. Over time, technologies proven in specialty units-such as LIDAR-guided sprayers-should cascade into mainstream utility models once volumes cut component pricing, widening their appeal.
The United States Tractor Market Report is Segmented by Horsepower (Below 40 HP, 40-100 HP, and More), by Type (Utility Tractors, Row Crop Tractors, Orchard and Vineyard Tractors, and More), by Drive Type (Two-Wheel Drive (2WD), Four-Wheel Drive (4WD), and More), and by Application (Cereals and Oilseeds, Fruits and Vegetables, and More). The Market Forecasts are Provided in Terms of Value (USD).
List of Companies Covered in this Report:
- Deere and Company
- CNH Industrial N.V.
- AGCO Corporation
- Kubota Corporation
- Mahindra&Mahindra Ltd.
- CLAAS KGaA mbH
- SDF S.p.A. (Deutz-Fahr)
- LS Mtron Ltd.
- Daedong-USA, Inc.
- Yanmar Holdings Co., Ltd.
- TYM Corporation
- Asko Holding
- JC Bamford Excavators Ltd.
- Doosan Bobcat
- Monarch Tractor
Additional Benefits:
- The market estimate (ME) sheet in Excel format
- 3 months of analyst support
TABLE OF CONTENTS
1 Introduction
- 1.1 Study Assumptions and Market Definition
- 1.2 Scope of the Study
2 Research Methodology
3 Executive Summary
4 Market Landscape
- 4.1 Market Overview
- 4.2 Market Drivers
- 4.2.1 Continuous electrification of sub-100 HP models
- 4.2.2 Smart-implement compatibility boosts replacement demand
- 4.2.3 Advanced telematics lower total cost of ownership
- 4.2.4 Precision-Ag incentives in the 2023 U.S. Farm Bill
- 4.2.5 Autonomous retrofit kits reach commercial price points
- 4.2.6 Carbon-credit monetization for low-HP tractors
- 4.3 Market Restraints
- 4.3.1 High upfront and maintenance costs of Tier-4 final engines
- 4.3.2 Fragmented dealership coverage in mountain states
- 4.3.3 Shortage of skilled technicians for sensor-laden models
- 4.3.4 Slow rural 5G rollout limits real-time data services
- 4.4 Regulatory Landscape
- 4.5 Technological Outlook
- 4.6 Porter's Five Forces Analysis
- 4.6.1 Threat of New Entrants
- 4.6.2 Bargaining Power of Buyers
- 4.6.3 Bargaining Power of Suppliers
- 4.6.4 Threat of Substitute Products
- 4.6.5 Intensity of Competitive Rivalry
5 Market Size and Growth Forecasts (Value)
- 5.1 By Horsepower
- 5.1.1 Below 40 HP
- 5.1.2 40-100 HP
- 5.1.3 Above 100 HP
- 5.2 By Tractor Type
- 5.2.1 Utility Tractors
- 5.2.2 Row-Crop Tractors
- 5.2.3 Orchard and Vineyard Tractors
- 5.2.4 Other Tractor Types
- 5.3 By Drive Type
- 5.3.1 Two-Wheel Drive (2WD)
- 5.3.2 Four-Wheel Drive (4WD)
- 5.3.3 Autonomous / Driverless
- 5.4 By Application
- 5.4.1 Cereals and Oilseeds
- 5.4.2 Fruits and Vegetables
- 5.4.3 Livestock Operations
- 5.4.4 Others
6 Competitive Landscape
- 6.1 Market Concentration
- 6.2 Strategic Moves
- 6.3 Market Share Analysis
- 6.4 Company Profiles (Includes Global Level Overview, Market Level Overview, Core Segments, Financials As Available, Strategic Information, Market Rank/Share for Key Companies, Products and Services, and Recent Developments)
- 6.4.1 Deere and Company
- 6.4.2 CNH Industrial N.V.
- 6.4.3 AGCO Corporation
- 6.4.4 Kubota Corporation
- 6.4.5 Mahindra&Mahindra Ltd.
- 6.4.6 CLAAS KGaA mbH
- 6.4.7 SDF S.p.A. (Deutz-Fahr)
- 6.4.8 LS Mtron Ltd.
- 6.4.9 Daedong-USA, Inc.
- 6.4.10 Yanmar Holdings Co., Ltd.
- 6.4.11 TYM Corporation
- 6.4.12 Asko Holding
- 6.4.13 JC Bamford Excavators Ltd.
- 6.4.14 Doosan Bobcat
- 6.4.15 Monarch Tractor
7 Market Opportunities and Future Outlook

