
PUBLISHER: Mordor Intelligence | PRODUCT CODE: 1848342

PUBLISHER: Mordor Intelligence | PRODUCT CODE: 1848342
Electrophoresis Equipment And Supplies - Market Share Analysis, Industry Trends & Statistics, Growth Forecasts (2025 - 2030)
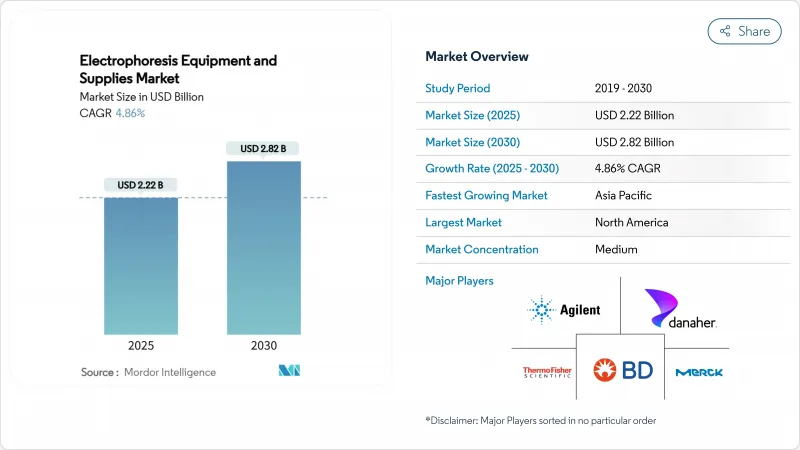
The electrophoresis equipment and supplies market size stands at USD 2.22 billion in 2025 and is forecast to reach USD 2.82 billion by 2030, reflecting a 4.86% CAGR over the period.
This growth trajectory is steady rather than explosive, mirroring a maturing landscape in which biopharmaceutical R&D, clinical diagnostics, and regulated quality-control testing continue to rely on electrophoretic separation even as competing technologies proliferate. Personalized medicine programs now require high-throughput molecular characterization, which keeps capital equipment investments resilient and drives a robust consumables replacement cycle. At the same time, biologics manufacturing hubs are standardizing capillary systems for in-process and release testing of monoclonal antibodies, sustaining demand for integrated platforms that bundle hardware, reagents, and analysis software. Competitive pressure from liquid chromatography-mass spectrometry remains a real headwind, yet recurring reagent revenue, the installed base advantage of legacy suppliers, and the technology's established regulatory pathway combine to support consistent expansion of the electrophoresis equipment and supplies market.
Global Electrophoresis Equipment And Supplies Market Trends and Insights
Growing Adoption of Personalized Medicine and Genomic Diagnostics
Capillary electrophoresis couples seamlessly with PCR workflows to deliver rapid, automated detection of gene variants underlying disorders such as cystic fibrosis and Huntington's disease. Performance benchmarks published in Clinical Chemistry and Laboratory Medicine confirm that electrophoresis can screen hundreds of samples per shift with minimal hands-on time, which reduces operational costs for hospital labs. Point-of-care microfluidic devices now bring this capability to bedside settings, where compact cartridges complete separations in less than five minutes, underscoring the modality's relevance to precision-care protocols.
Expansion of Academic and Contract Research Infrastructure Worldwide
Government-funded laboratory build-outs across India, China, Indonesia, and Nigeria position electrophoresis as a foundational teaching and research tool. Enrollment surges in molecular-biology programs have triggered bulk procurements of basic horizontal and vertical gel units as well as entry-level capillary systems. Contract research organizations (CROs) carry this momentum forward by integrating electrophoretic assays into multi-omic service lines, ensuring steady consumables pull-through across regional hubs.
High Capital and Operating Costs of Advanced Electrophoresis Systems
State-of-the-art capillary genetic analyzers list between USD 75,000 and USD 150,000. Consumables, including polymer matrices and capillaries, can outstrip the initial hardware outlay within three years of routine use. Proposed tariff schedules on analytical imports would add USD 63 billion to operating budgets across life-science sectors, prompting smaller laboratories to postpone refresh plans. Supply chain interruptions in high-purity buffers underscore the fragility of the cost structure, making price a primary adoption barrier in resource-constrained geographies.
Other drivers and restraints analyzed in the detailed report include:
- Rising Demand for High-Throughput Quality Control in Biologics Manufacturing
- Convergence with Microfluidics and Automation Platforms
- Competition from Alternative Separation Technologies Such as LC-MS
For complete list of drivers and restraints, kindly check the Table Of Contents.
Segment Analysis
Electrophoresis equipment and supplies market size for reagents and consumables was USD 1.03 billion in 2024, equating to 46.43% of overall revenue. Buffer concentrates, pre-cast gels, fluorescent stains, and molecular weight ladders are single-use or limited-reuse items, guaranteeing a replenishment cycle that cushions revenue against capital-spending lulls. Systems sales remain cyclical but software and imaging suites are forecast to compound at 6.54% annually as laboratories retrofit legacy gel boxes with AI-enabled documentation modules. The University of Edinburgh GelGenie engine exemplifies this transition by parsing faint bands with pixel-level accuracy and automatically generating compliance-ready reports.
Advances in microfluidic cartridges carve out a new hybrid category of chip-based consumables plus bench-top analyzers. Each lab-on-a-chip run consumes nanoliter volumes, reducing reagent purchases by as much as 90%, but drives higher chip revenue in aggregate, a trade-off vendors leverage to stabilize margin profiles. Smart-maintenance dashboards inside next-generation instruments prompt automatic re-ordering of buffers and capillaries, reinforcing the consumables-first business model that underpins the electrophoresis equipment and supplies market.
Genomics workflows controlled 55.43% of electrophoresis equipment and supplies market share in 2024 on the back of DNA sample preparation, RNA integrity checks, and fragment analysis protocols that precede NGS or qPCR. Yet the highest CAGR through 2030 belongs to clinical diagnostics at 7.02%, buoyed by CE-SDS validation for protein therapeutics and the FDA Class I exemption that simplifies implementation in hospital labs. Proteomics continues to pivot toward capillary isoelectric focusing for charge-variant monitoring, where industry round-robin studies across ten labs yielded relative standard deviations under 5% on pI values, meeting stringent release criteria.
Electrophoresis remains well suited to frontline screening tasks that need quick turnaround, limited sample triage, and definitive visual confirmation. As clinical labs migrate to outpatient settings, the technology's modest footprint and self-contained consumables give it a logistical edge over mass spectrometers that demand controlled utilities.
The Electrophoresis Equipment and Supplies Market Report is Segmented by Product (Systems, Reagents & Consumables, and Software & Imaging Solutions), Application (Genomics, and More), Workflow Stage (Sample Preparation, Separation, and Visualization), and Geography (North America, Europe, Asia-Pacific, MEA, South America). The Market Forecasts are Provided in Terms of Value (USD).
Geography Analysis
North America contributed 42.45% of global revenue in 2024 thanks to its dense biopharma cluster, clear FDA guidance, and deep installed base of gel and capillary systems FDA.GOV. Replacement demand centers on fully automated hardware that integrates electronic batch records to streamline GMP compliance. Tariff uncertainty on scientific imports could raise acquisition costs for niche components but is unlikely to disrupt consumables flows, which are predominantly regionally manufactured.
Asia-Pacific is the fastest-advancing territory with a projected 5.67% CAGR. China's 14th Five-Year Plan earmarks substantial funding for college-level biochemistry labs, while India's production-linked incentive program covers analytical instruments, triggering procurement waves across university networks. Japan and South Korea continue to favor premium capillary systems for biosimilar development, reinforcing steady high-value demand.
Europe maintains equilibrium growth, balancing rising biotech start-ups with cost-containment in public health systems. EU device regulation harmonization simplifies pan-regional launches, but sustainability directives push vendors to minimize plastic waste in consumables. Latin America and MEA remain nascent yet promising: national health ministries in Brazil and Saudi Arabia now require electrophoresis confirmation for hemoglobinopathy newborn screening, establishing a foothold for future platform upgrades.
- Agilent Technologies
- Bio-Rad Laboratories
- Thermo Fisher Scientific
- Danaher (Cytiva & Beckman Coulter)
- Merck
- GE Healthcare
- PerkinElmer
- QIAGEN
- Lonza Group Ltd.
- Shimadzu
- Sebia
- SCIEX
- Helena Laboratories
- Cleaver Scientific Ltd.
- Analytik Jena
- Lumex Instruments
- Consort NV
- Bio-Techne (ProteinSimple)
- Hitachi High-Tech Corp.
- Creative Diagnostics
Additional Benefits:
- The market estimate (ME) sheet in Excel format
- 3 months of analyst support
TABLE OF CONTENTS
1 Introduction
- 1.1 Study Assumptions & Market Definition
- 1.2 Scope of the Study
2 Research Methodology
3 Executive Summary
4 Market Landscape
- 4.1 Market Overview
- 4.2 Market Drivers
- 4.2.1 Accelerating Biopharmaceutical Research and Development Expenditure
- 4.2.2 Growing Adoption of Personalized Medicine and Genomic Diagnostics
- 4.2.3 Expansion of Academic and Contract Research Infrastructure Worldwide
- 4.2.4 Rising Demand for High-Throughput Quality Control in Biologics Manufacturing
- 4.2.5 Increasing Government Funding for Molecular Biology Education Programs In Emerging Economies
- 4.2.6 Convergence of Electrophoresis With Microfluidics and Automation Platforms
- 4.3 Market Restraints
- 4.3.1 High Capital and Operating Costs of Advanced Electrophoresis Systems
- 4.3.2 Competition from Alternative Separation Technologies Such as LC-MS
- 4.3.3 Limited Skilled Workforce for Complex Data Interpretation in Developing Regions
- 4.3.4 Vulnerabilities in Supply Of Critical High-Purity Reagents and Consumables
- 4.4 Regulatory Landscape
- 4.5 Porter's Five Forces Analysis
- 4.5.1 Threat of New Entrants
- 4.5.2 Bargaining Power of Buyers
- 4.5.3 Bargaining Power of Suppliers
- 4.5.4 Threat of Substitutes
- 4.5.5 Intensity of Rivalry
5 Market Size & Growth Forecasts (Value, USD)
- 5.1 By Product
- 5.1.1 Systems
- 5.1.1.1 Gel Electrophoresis Systems
- 5.1.1.2 Capillary Electrophoresis Systems
- 5.1.1.3 Microfluidic Electrophoresis Systems
- 5.1.2 Reagents & Consumables
- 5.1.2.1 Gels & Buffers
- 5.1.2.2 Stains & Dyes
- 5.1.2.3 Membranes & Blotting Media
- 5.1.2.4 Molecular Weight Standards & Ladders
- 5.1.3 Software & Imaging Solutions
- 5.1.3.1 Gel Documentation & Analysis Software
- 5.1.3.2 CE Data Analysis Platforms
- 5.1.3.3 AI-Driven Automation Suites
- 5.1.1 Systems
- 5.2 By Application
- 5.2.1 Genomics (DNA/RNA Analysis)
- 5.2.2 Proteomics (Protein Characterization)
- 5.2.3 Clinical Diagnostics
- 5.2.4 Quality Control & Process Validation
- 5.3 By Workflow Stage
- 5.3.1 Sample Preparation & Loading
- 5.3.2 Separation & Fractionation
- 5.3.3 Visualization, Imaging & Data Analysis
- 5.4 By End-User
- 5.4.1 Academic & Research Institutes
- 5.4.2 Hospitals & Diagnostic Centers
- 5.4.3 Pharmaceutical & Biotechnology Companies
- 5.5 Geography
- 5.5.1 North America
- 5.5.1.1 United States
- 5.5.1.2 Canada
- 5.5.1.3 Mexico
- 5.5.2 Europe
- 5.5.2.1 Germany
- 5.5.2.2 United Kingdom
- 5.5.2.3 France
- 5.5.2.4 Italy
- 5.5.2.5 Spain
- 5.5.2.6 Rest of Europe
- 5.5.3 Asia-Pacific
- 5.5.3.1 China
- 5.5.3.2 Japan
- 5.5.3.3 India
- 5.5.3.4 Australia
- 5.5.3.5 South Korea
- 5.5.3.6 Rest of Asia-Pacific
- 5.5.4 Middle East & Africa
- 5.5.4.1 GCC
- 5.5.4.2 South Africa
- 5.5.4.3 Rest of Middle East & Africa
- 5.5.5 South America
- 5.5.5.1 Brazil
- 5.5.5.2 Argentina
- 5.5.5.3 Rest of South America
- 5.5.1 North America
6 Competitive Landscape
- 6.1 Market Concentration
- 6.2 Market Share Analysis
- 6.3 Company Profiles (includes Global level Overview, Market level overview, Core Business Segments, Financials, Headcount, Key Information, Market Rank, Market Share, Products and Services, and analysis of Recent Developments)
- 6.3.1 Agilent Technologies Inc.
- 6.3.2 Bio-Rad Laboratories Inc.
- 6.3.3 Thermo Fisher Scientific Inc.
- 6.3.4 Danaher (Cytiva & Beckman Coulter)
- 6.3.5 Merck KGaA (Millipore Sigma)
- 6.3.6 GE Healthcare
- 6.3.7 PerkinElmer Inc.
- 6.3.8 QIAGEN N.V.
- 6.3.9 Lonza Group Ltd.
- 6.3.10 Shimadzu Corporation
- 6.3.11 Sebia Group
- 6.3.12 SCIEX
- 6.3.13 Helena Laboratories
- 6.3.14 Cleaver Scientific Ltd.
- 6.3.15 Analytik Jena AG
- 6.3.16 Lumex Instruments
- 6.3.17 Consort NV
- 6.3.18 Bio-Techne (ProteinSimple)
- 6.3.19 Hitachi High-Tech Corp.
- 6.3.20 Creative Diagnostics
7 Market Opportunities & Future Outlook
- 7.1 White-space & Unmet-need Assessment

