
PUBLISHER: Mordor Intelligence | PRODUCT CODE: 1849823

PUBLISHER: Mordor Intelligence | PRODUCT CODE: 1849823
Ethyl Acetate - Market Share Analysis, Industry Trends & Statistics, Growth Forecasts (2025 - 2030)
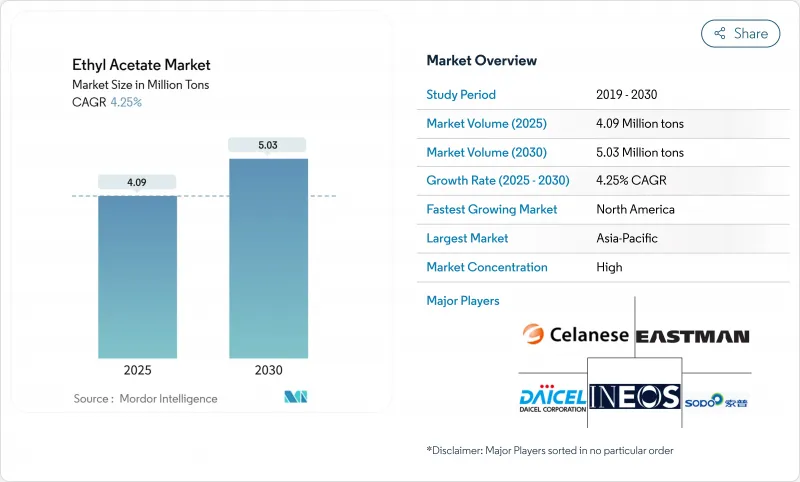
The ethyl acetate market stands at 4.09 million tons in 2025 and is forecast to reach 5.03 million tons by 2030, registering a 4.25% CAGR between 2025 and 2030.
Growth is anchored in the solvent segment of paints and coatings, pharmaceutical-grade demand, and the European shift to low-VOC formulations. Capacity additions in China are holding global prices down, prompting Western producers to pivot toward specialty and bio-based grades. North America benefits from pharmaceutical expansion and emerging renewable routes, yet faces feedstock price swings. Competitive success increasingly depends on vertical integration, premium-grade positioning, and agile compliance with fragmented regulatory regimes.
Global Ethyl Acetate Market Trends and Insights
Rising Demand in Solvent Applications
Paints and coatings, construction recovery, and automotive refinishing keep solvent usage at the center of ethyl acetate market expansion. The segment commands reliable demand because the solvent balances fast flash-off with high solvency power, delivering high-gloss finishes. Formulators are reformulating to meet low-VOC targets without losing performance, and ethyl acetate's relatively low toxicity encourages further substitution from ketones. Integrated producers have invested in upstream acetic acid to secure margin stability, shielding them from feedstock uncertainty. Asia-Pacific construction projects and automotive export growth amplify volumes, while Europe prizes compliant formulations that align with tightening emission caps
Growth of the Pharmaceutical Sector
Demand for pharmaceutical/GMP grade material is climbing faster than overall consumption, as complex active pharmaceutical ingredients require consistent solvent quality. Continuous manufacturing lines specify narrow impurity profiles, raising barriers for non-specialized suppliers. Producers are upgrading purification technologies, including fractional distillation and adsorptive polishing, to meet pharmacopoeial monographs. Higher margins insulate this niche from commodity price swings that weigh on industrial grades. North American investments in API capacity and Europe's focus on reshoring critical medicine supply strengthen regional consumption.
Conversion to Water-borne Adhesives in Europe
European packaging and woodworking lines are moving to acrylic dispersions to meet internal sustainability pledges. As water-borne chemistries gain share, industrial buyers cut orders for solvent-based adhesives that typically contain ethyl acetate. Performance gaps are narrowing but remain for high-speed laminations, so displacement is uneven across sub-segments. Solvent demand now concentrates in specialty niches where peel strength and heat resistance matter most. Suppliers are countering volume losses by launching bio-based ethyl acetate grades that complement corporate greenhouse-gas targets.
Other drivers and restraints analyzed in the detailed report include:
- EU Shift to Low-VOC Solvents
- Increasing Demand for Personal Care Products
- Volatile Acetic Acid Feedstock Prices
For complete list of drivers and restraints, kindly check the Table Of Contents.
Segment Analysis
The industrial/coatings grade retained a 60% ethyl acetate market share during 2024, supported by broad deployment in paints, inks, and general solvents. Competitive pricing from Chinese exporters keeps this segment commoditized, pressuring Western operators to lift efficiency and explore downstream specialty blends. Pharmaceutical/GMP grade, though smaller in volume, registered a 5.3% CAGR and is forecast to stay ahead of overall ethyl acetate market growth. Heightened regulatory scrutiny of residual solvents in drug manufacture is driving investment in advanced purification columns and online quality monitoring. Producers with validated GMP systems enjoy premium pricing and stickier customer contracts. Continuous manufacturing in large North American API plants further entrenches demand for high-purity lots that arrive on just-in-time schedules. The resilience of this niche points to a gradual shift in ethyl acetate industry capacity planning toward fewer, higher margin molecules that shield participants from commodity price cycles.
Regulators in the EU and the United States require full traceability of solvent provenance, compelling suppliers to certify agricultural ethanol or acetic acid raw materials. As a result, pharma-grade producers are deepening ties with feedstock suppliers to guarantee consistent isotopic fingerprints. This alignment enhances supply security while signaling adherence to environmental, social, and governance expectations. Capital requirements for clean-room packaging and dedicated storage tanks limit new entrants, effectively raising barriers that defend incumbent margins.
Petro-based variants dominated 2024 with 90% volume, benefiting from integrated acetic acid routes and favorable scale economies. Yet the bio-based pathway is expanding at a 6.30% CAGR, comfortably outperforming the ethyl acetate market. Suppliers exploit ethanol fermentation from sugarcane, corn, or residual biomass to reduce carbon intensity. Godavari Biorefineries is ramping up its distillery to 1,000 KLPD, enabling greater output of renewable ester grades that qualify for low-carbon labeling. Early adopters in flexible packaging are willing to pay a green premium when carbon disclosures influence brand perception.
Investment continues in enzymatic esterification and solid acid catalysis that lower energy footprints versus conventional Fischer esterification. European producers also benefit from the Renewable Energy Directive that values bio-based content in chemicals. Although feedstock logistics constrain absolute scale, policy incentives and corporate climate goals safeguard offtake agreements. Over the medium term, bio-based volumes are expected to erode petro-based share gradually, especially in markets with carbon taxation or mandated renewable quotas.
The Ethyl Acetate Market Report Segments the Industry by Purity Grade (Industrial/Coatings Grade, Food Grade, Pharmaceutical/GMP Grade), Source (Petro-Based and Bio-Based), Application (Paints and Coatings, Flexible-Packaging Inks, and More), End-User Industry (Automotive, Artificial Leather, and More), and Geography (Asia-Pacific, North America, Europe, and More). The Market Forecasts are Provided in Terms of Volume (tons).
Geography Analysis
Asia-Pacific commanded 73% of global volume in 2024 and anchors pricing. China's recently commissioned plants operate below optimal utilization, creating export pressure that influences delivered costs worldwide. Regional demand spans automotive coatings, artificial leather, and packaging inks, ensuring large internal offtake even as exports climb. India emerges as a demand bright spot, buoyed by national pharmaceutical expansion and government incentives for bio-fuel-derived chemicals. Corporations such as Godavari Biorefineries leverage abundant sugarcane feedstock to support renewable ethyl acetate, diversifying supply away from purely fossil routes.
North America is projected to record the quickest 5.40% CAGR through 2030. The region enjoys shale-advantaged feedstock pricing, partial backward integration, and proximity to a robust pharmaceutical sector that requires GMP-grade solvent. Nevertheless, acetic acid volatility remains a recurring risk. Celanese's Clear Lake expansion helps cushion supply shocks, yet non-integrated producers continue to hedge with multi-supplier contracts. Increasing environmental scrutiny promotes pilot-scale bio-based projects that could capture policy incentives under federal low-carbon initiatives.
Europe presents a dual reality of stringent regulation and premium applications. Demand is stable in offset printing, flexible packaging, and high-purity pharmaceutical uses, but conversion to water-borne adhesives restrains solvent volumes in construction. The Industrial Emissions Directive accelerates low-VOC solvent substitution, favoring ethyl acetate over aromatic alternatives. Producers emphasize specialty grades to offset rising energy and carbon costs, ensuring the region remains an importer despite local capacity. Exporters from Asia must navigate anti-dumping duties that the European Commission periodically reviews to protect domestic margins.
- Celanese Corporation
- Daicel Corporation
- Eastman Chemical Company
- Godavari Biorefineries Ltd
- Greenfield Global Inc.
- INEOS
- Jiangsu Baichuan High-tech New Materials Co., Ltd
- Jiangsu SOPO (Group) Co. Ltd
- Jubilant Pharmova Ltd
- PetroChina Company Limited
- PT Pertamina (Persero)
- Resonac Holdings Corporation
- Sasol Ltd
- SEKAB
- Sipchem Company
- Solvay
- Tokuyama Corporation
- Viridis Chemical, LLC.
- Yip's Chemical Holdings Limited
Additional Benefits:
- The market estimate (ME) sheet in Excel format
- 3 months of analyst support
TABLE OF CONTENTS
1 Introduction
- 1.1 Study Assumptions and Market Definition
- 1.2 Scope of the Study
2 Research Methodology
3 Executive Summary
4 Market Landscape
- 4.1 Market Overview
- 4.2 Market Drivers
- 4.2.1 Rising Demand in Solvent Applications
- 4.2.2 Growth of the Pharmaceutical Sector
- 4.2.3 EU shift to low-VOC solvents boosting offset-printing consumption
- 4.2.4 Increasing Demand for Personal Care Products
- 4.3 Market Restraints
- 4.3.1 Conversion to water-borne adhesives in Europe
- 4.3.2 Volatile acetic-acid feedstock prices in North America
- 4.3.3 Global oversupply from recent Chinese capacity additions pressuring prices
- 4.3.4 Stringent Environmental Regulations
- 4.4 Value Chain Analysis
- 4.5 Porter's Five Forces
- 4.5.1 Bargaining Power of Suppliers
- 4.5.2 Bargaining Power of Buyers
- 4.5.3 Threat of New Entrants
- 4.5.4 Threat of Substitutes
- 4.5.5 Degree of Competition
5 Market Size and Growth Forecasts (Volume)
- 5.1 Segmentation by Purity Grade
- 5.1.1 Industrial/Coatings Grade
- 5.1.2 Food Grade
- 5.1.3 Pharmaceutical/GMP Grade
- 5.2 Segmentation by Source
- 5.2.1 Petro-based
- 5.2.2 Bio-based
- 5.3 Segmentation by Application
- 5.3.1 Paints and Coatings
- 5.3.2 Flexible-Packaging Inks
- 5.3.3 Adhesives and Sealants
- 5.3.4 Pigments and Dyes
- 5.3.5 Process Solvents
- 5.3.6 Others (Flavor and Fragrance Enhancers, Inks)
- 5.4 Segmentation by End-user Industry
- 5.4.1 Automotive
- 5.4.2 Artificial Leather
- 5.4.3 Food and Beverage
- 5.4.4 Pharmaceuticals
- 5.4.5 Others (Packaging)
- 5.5 Segmentation by Geography
- 5.5.1 Asia-Pacific
- 5.5.1.1 China
- 5.5.1.2 India
- 5.5.1.3 Japan
- 5.5.1.4 South Korea
- 5.5.1.5 ASEAN
- 5.5.1.6 Rest of Asia-Pacific
- 5.5.2 North America
- 5.5.2.1 United States
- 5.5.2.2 Canada
- 5.5.2.3 Mexico
- 5.5.3 Europe
- 5.5.3.1 Germany
- 5.5.3.2 United Kingdom
- 5.5.3.3 France
- 5.5.3.4 Italy
- 5.5.3.5 Nordics (Sweden, Norway, Finland, Denmark)
- 5.5.3.6 Rest of Europe
- 5.5.4 South America
- 5.5.4.1 Brazil
- 5.5.4.2 Argentina
- 5.5.4.3 Rest of South America
- 5.5.5 Middle East and Africa
- 5.5.5.1 Saudi Arabia
- 5.5.5.2 United Arab Emirates
- 5.5.5.3 Turkey
- 5.5.5.4 South Africa
- 5.5.5.5 Nigeria
- 5.5.5.6 Rest of East and Africa
- 5.5.1 Asia-Pacific
6 Competitive Landscape
- 6.1 Market Concentration
- 6.2 Strategic Moves
- 6.3 Market Share(%)/Ranking Analysis
- 6.4 Company Profiles (includes Global level Overview, Market level overview, Core Segments, Financials as available, Strategic Information, Market Rank/Share for key companies, Products and Services, and Recent Developments)
- 6.4.1 Celanese Corporation
- 6.4.2 Daicel Corporation
- 6.4.3 Eastman Chemical Company
- 6.4.4 Godavari Biorefineries Ltd
- 6.4.5 Greenfield Global Inc.
- 6.4.6 INEOS
- 6.4.7 Jiangsu Baichuan High-tech New Materials Co., Ltd
- 6.4.8 Jiangsu SOPO (Group) Co. Ltd
- 6.4.9 Jubilant Pharmova Ltd
- 6.4.10 PetroChina Company Limited
- 6.4.11 PT Pertamina (Persero)
- 6.4.12 Resonac Holdings Corporation
- 6.4.13 Sasol Ltd
- 6.4.14 SEKAB
- 6.4.15 Sipchem Company
- 6.4.16 Solvay
- 6.4.17 Tokuyama Corporation
- 6.4.18 Viridis Chemical, LLC.
- 6.4.19 Yip's Chemical Holdings Limited
7 Market Opportunities and Future Outlook
- 7.1 Growing Demand from Bio Based solvent
- 7.2 White-space and Unmet-need Assessment

