
PUBLISHER: Mordor Intelligence | PRODUCT CODE: 1850031

PUBLISHER: Mordor Intelligence | PRODUCT CODE: 1850031
Hybrid Vehicle - Market Share Analysis, Industry Trends & Statistics, Growth Forecasts (2025 - 2030)
The hybrid vehicle market size holds a value of USD 261.51 billion in 2025 and is forecast to reach USD 478.19 billion by 2030, advancing at 12.83% CAGR.
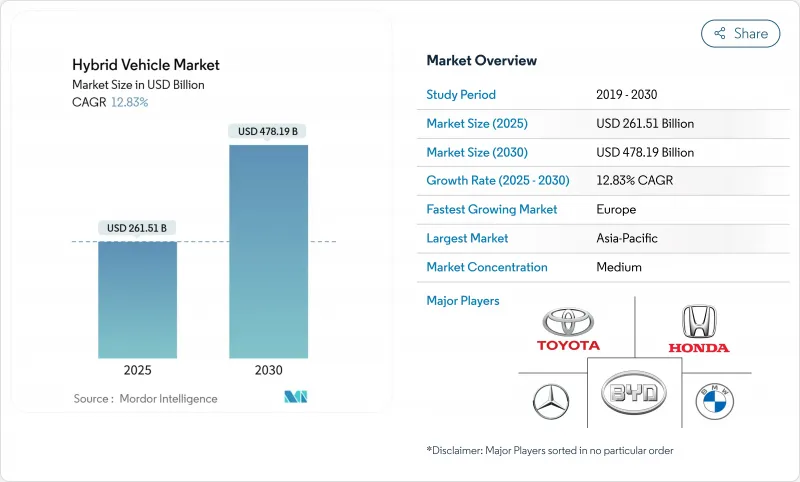
Rapid electrification policies, falling battery prices, and consumer determination to hedge against fuel volatility keep demand resilient across every major region. Automakers treat hybrids as profit engines that bankroll the scale-up of battery plants, while policymakers accept them as a practical compliance tool for tougher greenhouse-gas limits. Competitive intensity is escalating as Japanese incumbents fortify their lead, Chinese brands widen global reach, and Western OEMs re-enter the fray with new multi-pathway plans. Infrastructure disparities, regulatory convergence, and portfolio risk management together ensure the hybrid vehicle market remains strategically relevant for the next decade.
Global Hybrid Vehicle Market Trends and Insights
Stricter Global CAFE/GHG Norms & Zero-Emission Mandates
Fleetwide emissions ceilings in the United States and the European Union synchronize around the 2030 horizon, compelling automakers to employ hybrids to avoid penalties. The US Environmental Protection Agency sets targets of 85 g CO2 / mile for 2032, while Euro 7 introduces battery-durability rules that strongly favor mature hybrid chemistries. Automakers exploit the compliance flexibility inherent in hybrids to smooth the transition to full electrification, thereby safeguarding capital budgets earmarked for gigafactories. Similar policy architecture appears in Australia and China, creating a coherent regulatory scaffolding that lifts the global hybrid vehicle market.
Battery Cost-Parity Tipping Point for PHEVs by 2027
Lithium-ion pack prices slide toward USD 100 /kWh, narrowing the cost delta between plug-in hybrids and conventional models. CATL's 2024 Freevoy module delivers 4C charging and over 400 km electric-only range, slashing perceived compromises that once capped PHEV demand. Analysts at the International Council on Clean Transportation expect sub-USD 80 /kWh by 2030, anchoring a renewed value proposition that accelerates PHEV adoption, especially in China and Europe.
BEV Total-Cost-of-Ownership Parity Achieved in Urban Fleets
Depot charging, low electricity tariffs, and city toll exemptions allow battery-electric vans and taxis to undercut hybrid operating costs in dense corridors. Studies by Transport & Environment find medium BEVs 14% cheaper than diesel equivalents on a lifetime basis in Paris. As municipal infrastructure matures, fleet buyers may bypass hybrids in favor of zero-tailpipe solutions, trimming incremental growth in the hybrid vehicle market .
Other drivers and restraints analyzed in the detailed report include:
- Soaring Fuel-Price Volatility Post-2024
- OEM Multi-Pathway Carbon Strategies
- Scarcity of Sustainably Mined Nickel & Cobalt
For complete list of drivers and restraints, kindly check the Table Of Contents.
Segment Analysis
Hybrid electric vehicle account for 43.81% of the hybrid vehicle market, anchoring volume for mainstream passenger cars in 2025. Steady cost advantages and proven reliability keep demand resilient even as infrastructure improves. OEMs refine series-parallel architectures and downsize internal-combustion engines to maximize compliance credits. In contrast, plug-in hybrids record a 13.82% CAGR, closing the gap as buyers value electric-only commuting. Cost-parity milestones forecast for 2027 push PHEVs into wider price bands, broadening shopper appeal.
The hybrid electric vehicle market is likely to see plug-in variants challenge hybrid electric vehicle primacy after 2028 as energy-density gains permit sub-USD 25,000 sticker prices. CATL's Freevoy pack allows 10-minute top-ups that unlock 280 km of range, neutralizing range anxiety and underpinning the segment surge. Policy sweeteners such as China's tax credits and Europe's benefit-in-kind relief further tilt fleets toward PHEVs, ensuring technology coexistence rather than rapid displacement.
Passenger cars remain the bedrock of the hybrid vehicle market, controlling 78.04% revenue in 2024. High registration taxes on conventional engines in Europe and Japan funnel buyers into hybrids, while US consumers gravitate to fuel-efficient crossovers such as the hybrid-only 2025 Camry. OEM marketing stresses minimal lifestyle changes and quick payback, sustaining penetration in the world's largest light-vehicle segments.
Light commercial vehicles grow at 15.23% CAGR through 2030 as parcel-delivery, municipal, and trades fleets search for cost-effective decarbonization. Volkswagen's Multivan eHybrid and Ford's E-Transit Custom Hybrid illustrate how OEMs tailor battery size, payload, and charging flexibility for fleet duty cycles. The hybrid vehicle industry benefits from corporate ESG targets that require tangible emissions cuts before public charging networks fully saturate suburban and rural routes.
The Hybrid Vehicle Market Report is Segmented by Propulsion Type (Hybrid Electric Vehicle (HEV), Plug-In Hybrid (PHEV), and More), Vehicle Type (Passenger Cars, Light Commercial Vehicles, and More), Motor Type (Permanent Magnet Synchronous AC Motor (PMSM), Induction AC Motor, and More), Battery Type (Nickel-Metal Hydride, and More), and Geography. The Market Forecasts are Provided in Terms of Value (USD) and Volume (Units).
Geography Analysis
Asia-Pacific retains 41.24% of the hybrid vehicle market share in 2024 on the back of deep domestic supply chains, powerful policy support, and vibrant consumer demand. China accounts for most regional volume after plug-in hybrid registrations soared more than 80% annually between 2022 and 2024. BYD alone shifted nearly 2.5 million hybrids in 2024, scaling local battery plants that lower costs across ASEAN export programs. Japanese OEMs maintain hefty volumes at home and accelerate hybrid exports to Oceania, reinforcing a virtuous production loop that protects margins.
Europe is the fastest-growing geography with a projected 14.95% CAGR to 2030. The region's fuel-economy penalties, congestion charges, and company-car tax reliefs propel hybrid adoption even as BEV incentives taper. Italy's new-car mix hit 40% hybrids in 2024, and France passed 2 million rechargeable vehicles. Germany and the United Kingdom posted record electric-mobility shares, yet consumers still migrate to hybrids for long-distance convenience. Supply lines from Poland, Slovakia, and Spain attract fresh battery-module investment, shortening logistics for European assembly plants and sustaining downward cost curves that strengthen the hybrid vehicle market.
North America shows divergent provincial and state incentives, but national hybrid penetration climbed to 12.1% of light-vehicle sales in 2024. Regulatory certainty through the EPA's 2032 rule set catalyses broader model coverage across pickups and SUVs, while gasoline price spikes during 2024 cement mainstream acceptance. Emerging markets in South America, the Middle East and Africa rely on hybrids to leapfrog charging-infrastructure bottlenecks. Government fleets pilot hybrid buses and patrol vehicles, demonstrating use-case viability and paving the way for commercial uptake that enlarges the global hybrid vehicle market.
- Toyota Motor Corporation
- Honda Motor Co., Ltd.
- Nissan Motor Co., Ltd.
- Hyundai Motor Company
- Kia Corporation
- Ford Motor Company
- General Motors Company
- Stellantis N.V.
- BMW AG
- Mercedes-Benz Group AG
- Volkswagen AG
- BYD Co., Ltd.
- SAIC Motor Corporation
- Geely Automobile Holdings Ltd.
- Renault S.A.
- Volvo Car AB
- Subaru Corporation
- Mazda Motor Corporation
- Mitsubishi Motors Corporation
Additional Benefits:
- The market estimate (ME) sheet in Excel format
- 3 months of analyst support
TABLE OF CONTENTS
1 Introduction
- 1.1 Study Assumptions & Market Definition
- 1.2 Scope of the Study
2 Research Methodology
3 Executive Summary
4 Market Landscape
- 4.1 Market Overview
- 4.2 Market Drivers
- 4.2.1 Stricter global CAFE/GHG norms & zero-emission mandates
- 4.2.2 Soaring fuel-price volatility post-2024
- 4.2.3 Battery cost-parity tipping point for PHEVs by 2027
- 4.2.4 OEM multi-pathway carbon strategies (ICE + BEV + HEV)
- 4.2.5 48-V architecture standardisation in light trucks (under-the-radar)
- 4.2.6 Grid-independent emergency-power use case in disaster-prone regions (under-the-radar)
- 4.3 Market Restraints
- 4.3.1 BEV total-cost-of-ownership parity achieved in urban fleets
- 4.3.2 Scarcity of sustainably mined nickel & cobalt
- 4.3.3 Consumer range-anxiety bias shifting straight to BEV (under-the-radar)
- 4.3.4 Looming end-of-life recycling liabilities for NiMH packs (under-the-radar)
- 4.4 Value / Supply-Chain Analysis
- 4.5 Regulatory Landscape
- 4.6 Technological Outlook
- 4.7 Porter's Five Forces
- 4.7.1 Bargaining Power of Suppliers
- 4.7.2 Bargaining Power of Consumers
- 4.7.3 Threat of New Entrants
- 4.7.4 Threat of Substitute Products
- 4.7.5 Intensity of Competitive Rivalry
5 Market Size & Growth Forecasts (Value (USD) and Volume (Units))
- 5.1 By Hybrid Vehicle Type
- 5.1.1 Mild-Hybrid
- 5.1.2 Hybrid Electric Vehicle (HEV)
- 5.1.3 Plug-in Hybrid (PHEV)
- 5.2 By Vehicle Type
- 5.2.1 Passenger Cars
- 5.2.2 Light Commercial Vehicles
- 5.2.3 Medium and Heavy Commercial Vehicles
- 5.3 By Motor Type
- 5.3.1 Permanent Magnet Synchronous AC Motor (PMSM)
- 5.3.2 Induction (Asynchronous) AC Motor
- 5.3.3 Switched Reluctance Motor (SRM)
- 5.3.4 Axial-Flux Motor
- 5.4 By Battery Type
- 5.4.1 Nickel-Metal Hydride
- 5.4.2 Lithium-iron Phosphate Battery
- 5.4.3 Other Battery
- 5.5 By Geography
- 5.5.1 North America
- 5.5.1.1 United States
- 5.5.1.2 Canada
- 5.5.1.3 Rest of North America
- 5.5.2 South America
- 5.5.2.1 Brazil
- 5.5.2.2 Argentina
- 5.5.2.3 Rest of South America
- 5.5.3 Europe
- 5.5.3.1 Germany
- 5.5.3.2 United Kingdom
- 5.5.3.3 France
- 5.5.3.4 Italy
- 5.5.3.5 Norway
- 5.5.3.6 Netherlands
- 5.5.3.7 Rest of Europe
- 5.5.4 Asia-Pacific
- 5.5.4.1 China
- 5.5.4.2 Japan
- 5.5.4.3 India
- 5.5.4.4 South Korea
- 5.5.4.5 Rest of Asia-Pacific
- 5.5.5 Middle East and Africa
- 5.5.5.1 United Arab Emirates
- 5.5.5.2 Saudi Arabia
- 5.5.5.3 South Africa
- 5.5.5.4 Turkey
- 5.5.5.5 Egypt
- 5.5.5.6 Rest of Middle East and Africa
- 5.5.1 North America
6 Competitive Landscape
- 6.1 Market Concentration
- 6.2 Strategic Moves
- 6.3 Market Share Analysis
- 6.4 Company Profiles (Includes Global Level Overview, Market Level Overview, Core Segments, Financials as Available, Strategic Information, Market Rank/Share, Products & Services, Recent Developments)
- 6.4.1 Toyota Motor Corporation
- 6.4.2 Honda Motor Co., Ltd.
- 6.4.3 Nissan Motor Co., Ltd.
- 6.4.4 Hyundai Motor Company
- 6.4.5 Kia Corporation
- 6.4.6 Ford Motor Company
- 6.4.7 General Motors Company
- 6.4.8 Stellantis N.V.
- 6.4.9 BMW AG
- 6.4.10 Mercedes-Benz Group AG
- 6.4.11 Volkswagen AG
- 6.4.12 BYD Co., Ltd.
- 6.4.13 SAIC Motor Corporation
- 6.4.14 Geely Automobile Holdings Ltd.
- 6.4.15 Renault S.A.
- 6.4.16 Volvo Car AB
- 6.4.17 Subaru Corporation
- 6.4.18 Mazda Motor Corporation
- 6.4.19 Mitsubishi Motors Corporation
7 Market Opportunities & Future Outlook
- 7.1 White-space & Unmet-Need Assessment

