
PUBLISHER: Mordor Intelligence | PRODUCT CODE: 1850240

PUBLISHER: Mordor Intelligence | PRODUCT CODE: 1850240
Deep Learning - Market Share Analysis, Industry Trends & Statistics, Growth Forecasts (2025 - 2030)
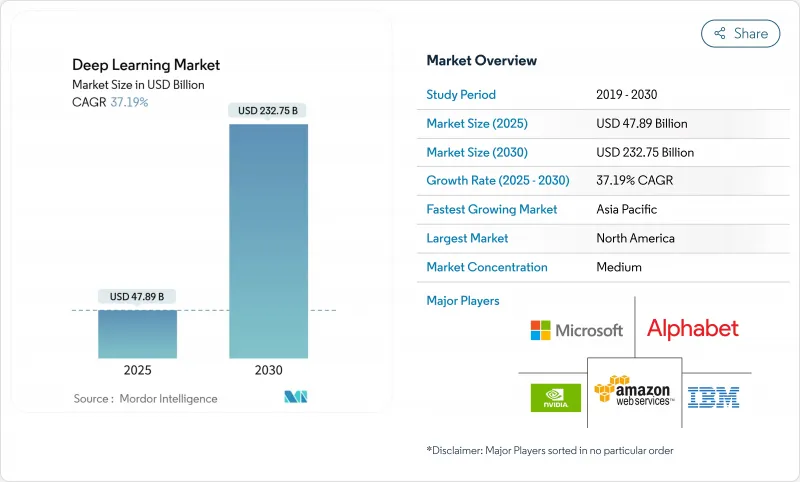
The deep learning market size is estimated at USD 47.89 billion in 2025 and is projected to reach USD 232.75 billion by 2030, advancing at a 37.19% CAGR.
Hardware accelerators now deliver larger models at lower latencies, while transformer breakthroughs accelerate adoption across every industry. Financial institutions, hospitals, manufacturers, and retailers embed neural networks directly into workflows instead of confining them to research labs. Hardware vendors, cloud platforms, and software specialists form new alliances that reduce time-to-deployment for enterprise buyers. At the same time, energy use, regulatory scrutiny, and skills shortages challenge the pace of scale-out.
Global Deep Learning Market Trends and Insights
Explosive Growth in Unstructured Data Volumes
Every day enterprises generate 2.5 quintillion bytes of information, and roughly 80% of that data remains unstructured. Optical neural processors now reach 1.57 peta-operations per second, enabling real-time video, audio, and text analysis for autonomous systems and industrial monitoring. Financial institutions report a 300% increase in alternative data feeds, including satellite imagery and social sentiment, which demands specialized models able to correlate disparate sources. Edge computing deployments rise 34% year over year as firms shift from batch analytics to low-latency inference. The resulting feedback loop boosts model accuracy while expanding addressable workloads.
Declining Cost and Performance Leap of AI Accelerators
Advanced 3-nanometer designs, stacked HBM memory, and photonic interconnects push compute costs down by 40% annually. NVIDIA's Blackwell Ultra delivers 1.5X performance over its prior generation. AMD's MI350 series posts 35X throughput gains versus earlier chips . These leaps allow mid-market companies to run 100-billion-parameter models on single-node systems instead of distributed clusters. Lower capital outlays widen the customer base and shorten procurement cycles, turning hardware into the fastest-growing deep learning market segment.
High Energy Footprint and Cooling Costs
AI clusters are projected to consume 46-82 TWh in 2025 and could rise to 1,050 TWh by 2030. Individual training runs now draw megawatt-hours of power, and racks outfitted for GPUs require 40-140 kW versus 10 kW for typical servers. Direct-liquid and immersion cooling add 15-20% to capital costs, while fluctuating renewable supply creates reliability challenges. Energy now represents up to 40% of total AI ownership costs, forcing buyers to weigh electricity tariffs and carbon objectives before scaling.
Other drivers and restraints analyzed in the detailed report include:
- Consumer-Grade DL Integration
- Medical-Imaging and Diagnostics Adoption Surge
- Scarcity of Specialized DL Talent
For complete list of drivers and restraints, kindly check the Table Of Contents.
Segment Analysis
Hardware posted a 37.5% CAGR forecast through 2030, propelled by demand for GPUs, custom ASICs, and wafer-scale engines. NVIDIA's GB10 Grace Blackwell superchip powers personal AI stations priced at USD 3,000 that can handle 200-billion-parameter models . Cerebras Systems demonstrates inference at 1,500 tokens per second on its wafer-scale platform, representing a 57-fold speed improvement over legacy GPU clusters. Telecommunication operators, automotive OEMs, and cloud providers adopt these accelerators to shrink floor space and energy consumption. Start-ups leverage lower capex to prototype vertical solutions, narrowing time-to-market for industry-specific applications.
Software and Services still command most revenues because recurring subscriptions, managed platforms, and integration projects generate predictable cash-flows. Vertical foundation models for healthcare, finance, and manufacturing drive service demand as clients seek domain expertise. Cloud vendors bundle model-as-a-service offerings with orchestration tools, letting enterprises avoid infrastructure management. Customization mandates consulting help, sustaining double-digit growth even as hardware outpaces in percentage terms. The symbiosis between hardware innovation and software monetization ensures balanced expansion across the deep learning market.
BFSI controlled 24.5% of deep learning market share in 2024, leveraging fraud detection, risk modeling, and algorithmic trading. Large banks integrate transformer-based customer-service agents that resolve 70% of queries on first contact, raising satisfaction scores and trimming costs. Payment networks embed anomaly detection on streaming data to block fraudulent transactions within milliseconds.
Healthcare and Life Sciences display the fastest 38.3% CAGR as diagnostic approvals surge. Radiology workflows that once required manual review now achieve instant triage, while genomic analysts deploy foundation models to identify promising drug targets in weeks instead of months. Hospitals adopt privacy-preserving federated learning to safeguard patient records, satisfying regulators and insurance providers. Pharmaceutical firms invest in AI-driven protein-folding and simulation tools, accelerating clinical trial timelines. This momentum positions healthcare as a pivotal revenue engine for the deep learning market.
Deep Learning Market is Segmented by Offering (Hardware, Software and Services), End User Industry (BFSI, Retail and ECommerce, Manufacturing, and More), Application (Image and Video Recognition, Speech and Voice Recognition, NLP and Text Analytics and More), Deployment (Cloud, On-Premises) and by Geography. The Market Forecasts are Provided in Terms of Value (USD).
Geography Analysis
North America held 32.5% of the deep learning market in 2024, semiconductor fabrication expands domestically as TSMC invests USD 165 billion in Arizona plants, reducing supply-chain risk. Canada capitalizes on research excellence to spin out NLP start-ups, while Mexico becomes a near-shore assembly base for AI hardware. Regional energy grids, especially in Virginia and Texas, struggle to accommodate racks drawing up to 140 kW, prompting utilities to accelerate renewable capacity.
Asia-Pacific is the fastest climber with a 37.2% CAGR forecas. India implements national AI centers that offer subsidized compute credits to start-ups, spawning a wave of fintech and agritech solutions. Japan leverages robotics heritage to commercialize service robots for aging populations, while South Korea couples 5G leadership with edge AI deployments in smart factories. Australia experiments with autonomous mining trucks, and Southeast Asian e-commerce firms apply recommendation engines to vast mobile consumer bases. The diversity of use cases underpins sustained regional demand for deep learning solutions.
Europe advances at a steady pace despite compliance overhead from the EU AI Act, which can impose fines up to 3% of global turnover for violations. German automakers integrate explainable AI for safety-critical perception in electric vehicles, while Italian machinery makers embed predictive maintenance analytics. Nordic countries power data centers with hydro and wind resources, marketing carbon-neutral AI services that appeal to sustainability-minded clients. The United Kingdom operates a flexible post-Brexit framework, attracting US and Asian firms seeking access to both European and Commonwealth markets. Collectively, these dynamics position Europe as a hub for responsible and energy-efficient deep learning market growth.
- NVIDIA Corporation
- Google LLC (Alphabet)
- Amazon Web Services, Inc.
- Microsoft Corporation
- IBM Corporation
- Meta Platforms, Inc.
- Intel Corporation
- Advanced Micro Devices, Inc.
- SAS Institute Inc.
- RapidMiner, Inc.
- Baidu, Inc.
- Qualcomm Technologies, Inc.
- Huawei Technologies Co., Ltd.
- Graphcore Ltd.
- Cerebras Systems, Inc.
- Xilinx (part of AMD)
- Samsung Electronics Co., Ltd.
- Oracle Corporation
- H2O.ai
- Databricks, Inc.
- SenseTime Group
- OpenAI LP
- Tesla, Inc.
- NEC Corporation
- Darktrace plc
Additional Benefits:
- The market estimate (ME) sheet in Excel format
- 3 months of analyst support
TABLE OF CONTENTS
1 INTRODUCTION
- 1.1 Study Assumptions and Market Definition
- 1.2 Scope of the Study
2 RESEARCH METHODOLOGY
3 EXECUTIVE SUMMARY
4 MARKET LANDSCAPE
- 4.1 Market Overview
- 4.2 Market Drivers
- 4.2.1 Explosive growth in unstructured data volumes
- 4.2.2 Declining cost and performance leap of AI accelerators
- 4.2.3 Consumer?grade DL integration (voice, vision, IoT)
- 4.2.4 Medical-imaging and diagnostics adoption surge
- 4.2.5 Vertical foundation models unlocking niche markets
- 4.2.6 Edge/on-device DL for privacy and ultra-low latency
- 4.3 Market Restraints
- 4.3.1 High energy footprint and cooling costs
- 4.3.2 Scarcity of specialised DL talent
- 4.3.3 Tightening global AI regulation (e.g., EU AI Act)
- 4.3.4 IP/copyright liability for training data
- 4.4 Supply-Chain Analysis
- 4.5 Regulatory Landscape
- 4.6 Technological Outlook
- 4.7 Porter's Five Force Analysis
- 4.7.1 Bargaining Power of Suppliers
- 4.7.2 Bargaining Power of Buyers
- 4.7.3 Threat of New Entrants
- 4.7.4 Threat of Substitutes
- 4.7.5 Intensity of Competitive Rivalry
- 4.8 Assesment of Macroeconomic Factors on the market
5 MARKET SIZE AND GROWTH FORECASTS (VALUE)
- 5.1 Segmentation by Offering
- 5.1.1 Hardware
- 5.1.2 Software and Services
- 5.2 Segmentation by End-user Industry
- 5.2.1 BFSI
- 5.2.2 Retail and eCommerce
- 5.2.3 Manufacturing
- 5.2.4 Healthcare and Life Sciences
- 5.2.5 Automotive and Transportation
- 5.2.6 Telecom and Media
- 5.2.7 Security and Surveillance
- 5.2.8 Other Applications
- 5.3 Segmentation by Application
- 5.3.1 Image and Video Recognition
- 5.3.2 Speech and Voice Recognition
- 5.3.3 NLP and Text Analytics
- 5.3.4 Autonomous Systems and Robotics
- 5.3.5 Predictive Analytics and Forecasting
- 5.3.6 Other Applications
- 5.4 Segmentation by Deployment Mode
- 5.4.1 Cloud
- 5.4.2 On-Premise
- 5.5 Segmentation by Geography
- 5.5.1 North America
- 5.5.1.1 United States
- 5.5.1.2 Canada
- 5.5.1.3 Mexico
- 5.5.2 South America
- 5.5.2.1 Brazil
- 5.5.2.2 Argentina
- 5.5.2.3 Rest of South America
- 5.5.3 Europe
- 5.5.3.1 Germany
- 5.5.3.2 United Kingdom
- 5.5.3.3 France
- 5.5.3.4 Italy
- 5.5.3.5 Spain
- 5.5.3.6 Russia
- 5.5.3.7 Rest of Europe
- 5.5.4 Asia-Pacific
- 5.5.4.1 China
- 5.5.4.2 Japan
- 5.5.4.3 India
- 5.5.4.4 South Korea
- 5.5.4.5 Australia
- 5.5.4.6 Rest of Asia-Pacific
- 5.5.5 Middle East and Africa
- 5.5.5.1 Middle East
- 5.5.5.1.1 Saudi Arabia
- 5.5.5.1.2 United Arab Emirates
- 5.5.5.1.3 Turkey
- 5.5.5.1.4 Rest of Middle East
- 5.5.5.2 Africa
- 5.5.5.2.1 South Africa
- 5.5.5.2.2 Nigeria
- 5.5.5.2.3 Egypt
- 5.5.5.2.4 Rest of Africa
- 5.5.1 North America
6 COMPETITIVE LANDSCAPE
- 6.1 Market Concentration
- 6.2 Strategic Moves
- 6.3 Market Share Analysis
- 6.4 Company Profiles (includes Global level Overview, Market level overview, Core Segments, Financials as available, Strategic Information, Market Rank/Share for key companies, Products and Services, and Recent Developments)
- 6.4.1 NVIDIA Corporation
- 6.4.2 Google LLC (Alphabet)
- 6.4.3 Amazon Web Services, Inc.
- 6.4.4 Microsoft Corporation
- 6.4.5 IBM Corporation
- 6.4.6 Meta Platforms, Inc.
- 6.4.7 Intel Corporation
- 6.4.8 Advanced Micro Devices, Inc.
- 6.4.9 SAS Institute Inc.
- 6.4.10 RapidMiner, Inc.
- 6.4.11 Baidu, Inc.
- 6.4.12 Qualcomm Technologies, Inc.
- 6.4.13 Huawei Technologies Co., Ltd.
- 6.4.14 Graphcore Ltd.
- 6.4.15 Cerebras Systems, Inc.
- 6.4.16 Xilinx (part of AMD)
- 6.4.17 Samsung Electronics Co., Ltd.
- 6.4.18 Oracle Corporation
- 6.4.19 H2O.ai
- 6.4.20 Databricks, Inc.
- 6.4.21 SenseTime Group
- 6.4.22 OpenAI LP
- 6.4.23 Tesla, Inc.
- 6.4.24 NEC Corporation
- 6.4.25 Darktrace plc
7 MARKET OPPORTUNITIES AND FUTURE OUTLOOK
- 7.1 White-space and Unmet-Need Assessment

