
PUBLISHER: Mordor Intelligence | PRODUCT CODE: 1850386

PUBLISHER: Mordor Intelligence | PRODUCT CODE: 1850386
Recombinant Protein - Market Share Analysis, Industry Trends & Statistics, Growth Forecasts (2025 - 2030)
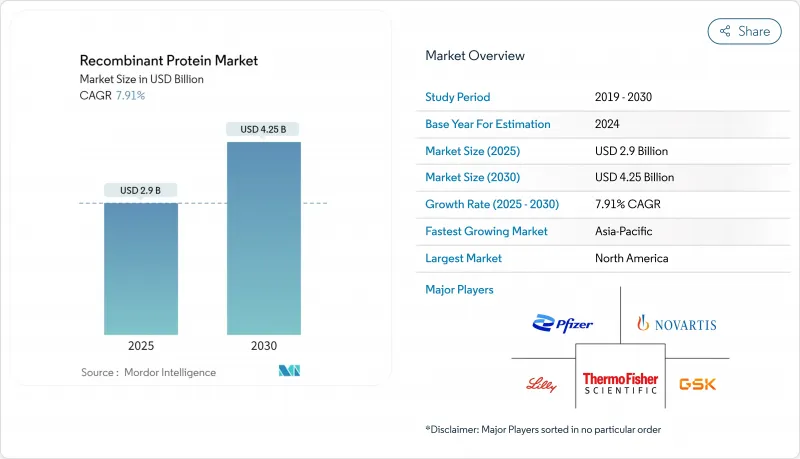
The global Recombinant Proteins market size is estimated at USD 2.9 billion in 2025 and is projected to climb to USD 4.25 billion by 2030, reflecting a steady 7.91 % CAGR.
Rapid uptake of protein-based therapeutics, wider acceptance of precision medicine, and expansion into food and industrial biotechnology underpin this forward momentum. An additional catalyst is the convergence of artificial intelligence with protein engineering, which is shortening design-to-clinic timelines and widening product pipelines. A fresh inference from these dynamics is that higher throughput discovery tools are gradually lowering entry barriers for midsized companies, nudging the industry toward a more distributed innovation model. Continued regulatory clarity around biosimilars and interchangeable products is expected to smooth commercial pathways and accelerate time-to-revenue for late-stage assets.
Despite this growth trajectory, structural headwinds persist. High capital intensity in mammalian cell culture, supply chain constraints for critical raw materials, and price erosion triggered by biosimilars weigh on margins, particularly for established blockbuster molecules. Currency fluctuations add complexity for producers with multi-regional manufacturing footprints, as the majority of production costs are denominated in USD while sales in emerging markets are booked in local currencies. The fresh inference here is that margin resilience is likely to hinge on operational agility, prompting more firms to adopt single-use technologies and continuous processing to fine-tune batch economics. As production platforms diversify, the Recombinant Proteins industry appears set to balance scientific innovation with cost efficiency in order to sustain long-term profitability.
Global Recombinant Protein Market Trends and Insights
Technological Advancements Accelerate Protein Engineering Capabilities
Breakthroughs in deep-learning structure prediction and de novo design are enabling researchers to specify binding sites, stability, and activity with unprecedented precision. Laboratory evidence indicates that split-intein strategies prevent misfolding in complex constructs, generating higher active yields without lengthy re-folding steps . The Recombinant Proteins industry is therefore seeing the design-to-production window contract from months to weeks, a shift that implicitly frees capacity for additional targets. One key inference is that in silico screening is becoming a strategic differentiator as much as physical manufacturing prowess.
Growing Burden of Chronic Diseases Drives Therapeutic Applications
Escalating incidence of oncology, autoimmune, and metabolic disorders is steering healthcare spending toward targeted biologics. More than one hundred monoclonal antibodies now hold regulatory approval, and recent FDA decisions reinforce confidence in protein-based modalities. Payers increasingly support earlier line use of biologics, reflecting their disease-modifying potential. The market inference is that sustained clinical demand can offset competitive pricing pressures provided products demonstrate clear health-economic value.
High Production Costs Constrain Market Expansion
Therapeutic antibody manufacturing often entails coat-check expenses such as single-use bags, complex growth media, and process analytics, pushing annual treatment costs beyond USD 100,000 for some indications. These economics can restrict formulary adoption despite clinical superiority. Continuous manufacturing, intensified bioreactors, and cell-free systems are therefore being piloted to uncouple cost from volume. The fresh inference is that cost-containment innovations will likely migrate first to high-volume insulin and EPO lines where price elasticity is strongest.
Other drivers and restraints analyzed in the detailed report include:
- Rising Inclination Toward Biologics & Biosimilars Reshapes Market Dynamics
- Personalized Recombinant Enzymes Address Rare Metabolic Disorders
- Government Biocluster Funding Accelerates Recombinant Biologics Capacity
- Biosimilar-Driven Price Erosion Challenges Established Products
For complete list of drivers and restraints, kindly check the Table Of Contents.
Segment Analysis
Cytokines and growth factors command the largest Recombinant Proteins market share at 24.6 % in 2024, reflecting robust demand in immunotherapy and regenerative medicine. Their signaling precision aligns with oncology's move toward micro-environment modulation, a factor that sustains premium pricing. A fresh inference is that next-generation interleukin variants with attenuated toxicity profiles will widen outpatient use cases.
Fusion proteins and bispecifics exhibit the fastest growth, with the segment forecast to register an 8.43 % CAGR through 2030. By merging targeting and effector domains into single molecules, these constructs simplify dosing regimens and can bypass multi-drug cocktails. A distinct inference is that lower administration complexity may increase adherence in chronic settings, indirectly expanding addressable market size.
The hormones subsector maintains a solid market size despite biosimilar encroachment, anchored by indispensable therapies such as insulin and EPO. Competitive headwinds are partially mitigated by delivery-device innovation that enhances patient convenience. The inference is that integrated drug-device bundles may preserve value even as list prices fall.
Enzyme replacement is experiencing mid-single-digit growth, stimulated by orphan-drug incentives and advances in glyco-engineering. Expanded newborn screening elevates diagnosis rates, which in turn enlarges the treated population. An inference here is that earlier intervention will generate longitudinal revenue streams that compensate for relatively small patient cohorts.
Mammalian platforms hold 45.15% Recombinant Proteins market share in 2024, driven by capacity to perform human-like post-translational modifications. Multiplex CRISPR editing is boosting viable cell density and extending fed-batch runs, an operational gain that lifts volumetric productivity . The inference is that genetic stabilization decreases batch-to-batch variability, a factor valued by regulators.
Cell-free and synthetic systems are clocking an 8.72% CAGR, offering days-long development cycles versus weeks for cell-based approaches. Demonstrations of 100 mg/L antibody titers in small-scale reactors validate industrial feasibility. A fresh inference is that decoupling expression from cell viability permits toxic or unstable proteins to enter pipelines previously deemed untenable.
The Recombinant Proteins Market Report Segments the Industry Into by Product (Hormone, Enzyme, and More), by Expression System (Mammalian, Bacterial, and More), by Application (Research, Therapeutic, and Industrial), by End User (Pharmaceutical & Biotechnology Companies, Academic & Research Institutes, and More) and Geography. The Market Sizes and Forecasts are Provided in Terms of Value (USD).
Geography Analysis
North America retained 41.13% Recombinant Proteins market share in 2024, driven by favorable reimbursement, venture capital availability, and a proactive regulatory stance. Federal funding for bio-industrial capacity upgrades further amplifies domestic production scaling. An emerging inference is that regional cluster density accelerates labor specialization, thereby increasing productivity per operator.
Europe remains the second-largest market, benefitting from cohesive academic-industry ecosystems and forward-leaning biosimilar guidelines. Anticipated easing of comparative trial requirements could lower development costs, making the region more attractive for small and midsized entrants. The inference is that regulatory harmonization across member states may compress launch timelines, leveling competition with North America.
Asia-Pacific is forecast to register a 9.51% CAGR from 2025 to 2030, reflecting aggressive national investment in biomanufacturing corridors and skilled workforce training programs. China's USD 4.17 billion commitment to expand capacity underscores the region's ambition to achieve self-reliance in biologics production. One inference is that early movers can capture contract manufacturing overflow from Western markets constrained by capacity bottlenecks, thereby redefining global supply chain geography.
- Abbvie
- Amgen
- Bio-Rad Laboratories
- Eli Lilly and Company
- Merck
- Novo Nordisk
- Sanofi
- Thermo Fisher Scientific
- Novartis
- GlaxoSmithKline
- Novavax
- Pfizer
- Sino Biological
- Bio-Techne Corp.
- GenScript Biotech Corp.
- Lonza Group
- Agilent Technologies
- Takara Bio
- Roche
- Regeneron Pharmaceuticals
- CSL Behring
Additional Benefits:
- The market estimate (ME) sheet in Excel format
- 3 months of analyst support
TABLE OF CONTENTS
1 Introduction
- 1.1 Study Assumptions & Market Definition
- 1.2 Scope of the Study
2 Research Methodology
3 Executive Summary
4 Market Landscape
- 4.1 Market Overview
- 4.2 Market Drivers
- 4.2.1 Technological Advancements in Recombinant Products
- 4.2.2 Growing burden of chronic diseases
- 4.2.3 Rising Inclination toward Biologics & Biosimilars
- 4.2.4 Personalised Recombinant Enzymes for Rare Metabolic Disorders (EU)
- 4.2.5 Personalised Recombinant Enzymes addressing rare metabolic disorders
- 4.2.6 Government Biocluster Funding accelerating recombinant biologics capacity
- 4.3 Market Restraints
- 4.3.1 High production costs
- 4.3.2 Price erosion and cold-chain gaps
- 4.3.3 Biosimilar-driven price erosion in insulin & EPO segments
- 4.3.4 Regulatory Ambiguity Around Cell-Free Expression Platforms
- 4.4 Supply-Chain Analysis
- 4.5 Regulatory & Technological Outlook
- 4.6 Porter's Five Forces
- 4.6.1 Threat of New Entrants
- 4.6.2 Bargaining Power of Buyers
- 4.6.3 Bargaining Power of Suppliers
- 4.6.4 Threat of Substitutes
- 4.6.5 Intensity of Competitive Rivalry
5 Market Size & Growth Forecasts (Value)
- 5.1 By Product
- 5.1.1 Hormones (Insulin, EPO, hGH, FSH)
- 5.1.2 Cytokines & Growth Factors (ILs, CSFs, IFNs)
- 5.1.3 Monoclonal Antibodies & Fragments
- 5.1.4 Enzymes
- 5.1.5 Fusion Proteins & Others
- 5.2 By Expression System
- 5.2.1 Mammalian (CHO & HEK293)
- 5.2.2 Bacterial (E. coli)
- 5.2.3 Yeast (Pichia, Saccharomyces)
- 5.2.4 Insect (Sf9, Sf21)
- 5.2.5 Cell-Free / Synthetic
- 5.3 By Application
- 5.3.1 Therapeutic
- 5.3.2 Research
- 5.3.3 Industrial (Agro-biotech, Food, Detergents)
- 5.4 By End User
- 5.4.1 Pharmaceutical & Biotechnology Companies
- 5.4.2 Academic & Research Institutes
- 5.4.3 CROs & CDMOs
- 5.5 By Geography
- 5.5.1 North America
- 5.5.1.1 United States
- 5.5.1.2 Canada
- 5.5.1.3 Mexico
- 5.5.2 Europe
- 5.5.2.1 Germany
- 5.5.2.2 United Kingdom
- 5.5.2.3 France
- 5.5.2.4 Italy
- 5.5.2.5 Spain
- 5.5.2.6 Rest of Europe
- 5.5.3 Asia-Pacific
- 5.5.3.1 China
- 5.5.3.2 Japan
- 5.5.3.3 India
- 5.5.3.4 South Korea
- 5.5.3.5 Australia
- 5.5.3.6 Rest of Asia-Pacific
- 5.5.4 Middle East
- 5.5.4.1 GCC
- 5.5.4.2 South Africa
- 5.5.4.3 Rest of Middle East
- 5.5.5 South America
- 5.5.5.1 Brazil
- 5.5.5.2 Argentina
- 5.5.5.3 Rest of South America
- 5.5.1 North America
6 Competitive Landscape
- 6.1 Market Concentration
- 6.2 Market Share Analysis
- 6.3 Company Profiles (includes Global-level Overview, Market-level Overview, Core Segments, Financials as available, Strategic Information, Market Rank/Share, Products & Services, Recent Developments)
- 6.3.1 AbbVie Inc.
- 6.3.2 Amgen Inc.
- 6.3.3 Bio-Rad Laboratories Inc.
- 6.3.4 Eli Lilly and Company
- 6.3.5 Merck KGaA
- 6.3.6 Novo Nordisk A/S
- 6.3.7 Sanofi SA
- 6.3.8 Thermo Fisher Scientific Inc.
- 6.3.9 Novartis AG
- 6.3.10 GlaxoSmithKline plc
- 6.3.11 Novavax Inc.
- 6.3.12 Pfizer Inc.
- 6.3.13 Sino Biological Inc.
- 6.3.14 Bio-Techne Corp.
- 6.3.15 GenScript Biotech Corp.
- 6.3.16 Lonza Group AG
- 6.3.17 Agilent Technologies Inc.
- 6.3.18 Takara Bio Inc.
- 6.3.19 F. Hoffmann-La Roche AG
- 6.3.20 Regeneron Pharmaceuticals Inc.
- 6.3.21 CSL Limited
7 Market Opportunities & Future Outlook
- 7.1 White-Space & Unmet-Need Assessment

