
PUBLISHER: Mordor Intelligence | PRODUCT CODE: 1850402

PUBLISHER: Mordor Intelligence | PRODUCT CODE: 1850402
Smart TV - Market Share Analysis, Industry Trends & Statistics, Growth Forecasts (2025 - 2030)
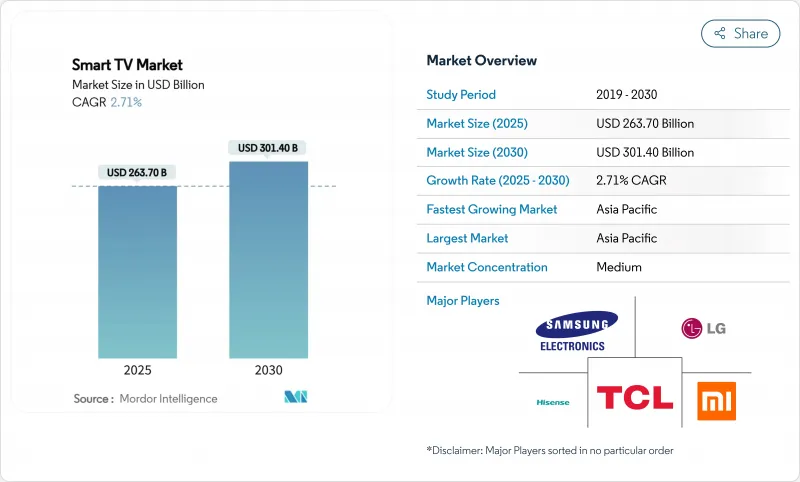
The smart TV market size stands at USD 263.7 billion in 2025 and is projected to reach USD 301.4 billion by 2030, expanding at a 2.71% CAGR.
Momentum now comes less from first-time ownership surges and more from incremental improvements such as AI-driven picture processing, integrated cloud-gaming features and value-chain localization that compresses costs while preserving margins. India's expanded production-linked incentives and similar manufacturing credits in Vietnam and Mexico are fostering near-source assembly hubs that shorten lead times and lower average selling prices Ministry of Commerce & Industry. Display makers are steering R&D toward Mini-LED backlighting and quantum-dot enhancements that counter OLED's supply constraints, while telecom operators bundle televisions with fiber plans to widen addressable households. Platform competition is shifting toward ad-supported content services and extended software-support promises, encouraging premium replacements even in mature regions.
Global Smart TV Market Trends and Insights
Price Erosion of 55-65" 4 K Sets Accelerating Mass Adoption in India and Brazil
Chinese OEMs pushed 55-inch 4 K retail pricing below USD 400 in 2024, a threshold that once signaled the premium tier. Aggressive promotions, such as TCL's drop on 98-inch models from USD 5,999 to USD 1,999, compelled rivals to broaden entry-level line-ups while preserving margins through localized sourcing . Samsung's Indian unit still reported INR 10,000 crore television revenue in 2024, underscoring that brand-led AI features can hold price points even amid deflation Lower barriers entice middle-income households into larger-screen categories and compress replacement cycles across value-sensitive markets.
Telecom-Led Fiber Roll-outs Catalyzing First-Time Ownership in Southeast Asia
Nationwide fiber plans in Indonesia, Thailand and Malaysia are shrinking broadband subscription costs and enabling seamless 4 K streaming. Operators now bundle entry-level 43-inch televisions with 100 Mbps contracts, creating integrated service propositions that sidestep traditional retail channels. As viewing shifts from mobile devices to living-room screens, addressable demand moves beyond urban cores into tier-2 cities, sustaining outperformance against the global smart TV market through 2030.
Semiconductor Tightness for Mini-LED Backlights Limiting Premium Supply
Mini-LED sets need thousands of driver ICs and densely packed diodes; wafer-fab capacity for these parts lagged surging demand in 2024. TrendForce estimates Mini-LED television shipments grew 59% to 6.4 million units in 2024, overwhelming available component supply. Lead times stretched beyond 30 weeks, prompting brands to prioritise flagship lines and delay mid-tier adopters. Supply relief hinges on new 12-inch fabs slated to ramp only in late 2026.
Other drivers and restraints analyzed in the detailed report include:
- Government PLI and Localization Incentives Lowering ASPs in India
- Integration of FAST Channels Spurring Upgrade Demand in North America
- Low-Cost Streaming Dongles Extending Replacement Cycles in Price-Sensitive Markets
For complete list of drivers and restraints, kindly check the Table Of Contents.
Segment Analysis
HD/Full HD still led revenue with 37.8% in 2024, sustained by cost-sensitive buyers in developing economies. Conversely, 8 K UHD is projected to compound at 4.2% and outsprint overall smart TV market growth through 2030. Samsung's Vision AI engine, rolled out in 2025, enhances lower-resolution streams to near-native 8 K quality and mitigates the shortage of ultra-high-bitrate content . EU ecodesign rules that limit peak brightness add pressure to engineer more efficient backlights, nudging brands toward Mini-LED over OLED for high-nit compliance.
Entry-level 4 K sets inherit premium features such as variable-refresh-rate gaming modes, blurring the mid-tier and expanding the total smart TV market. Content platforms also upscale catalogues to HDR10+ and Dolby Vision, reinforcing demand for higher-pixel-density panels that can render dynamic metadata accurately.
Mainstream 46-55-inch models captured 32.1% of the smart TV market in 2024. Average selling prices in this category fell 9% year on year after local assembly scaled in India and Mexico. Sets above 65 inches are forecast for a 3.8% CAGR and pull most premium technology attach-rates, including 120 Hz panels and object-tracking sound.
Manufacturers leverage shared glass-substrate fabs to push 98-inch LCDs below USD 2,000, making wall-sized viewing accessible to middle-income households. Pandemic-era home-theatre upgrades reconfigured living-room layouts, and those spatial changes now lock in preference for larger screens. Smaller than 32 inch remains viable for secondary rooms, yet the revenue mix shifts upward, underpinning profit pools despite moderate headline growth for the smart TV market.
The Smart TV Market Report is Segmented by Resolution (HD/Full HD, 4K UHD, and 8K UHD), Screen Size (Up To 32 Inch, 33-45 Inch, 46-55 Inch, and More), Panel/Display Technology (LED/LCD, OLED, QLED, Mini-LED, and More), Screen Shape (Flat, and Curved), Operating System (Android TV, and Other/OEM Proprietary), Distribution Channel (Offline Retail, and Online), and Geography. The Market Forecasts are Provided in Terms of Value (USD).
Geography Analysis
Asia-Pacific generated 41.2% of 2024 revenue and leads growth at 3.2% CAGR as domestic panel fabs in China and assembly hubs in India lower regional landed costs. New Delhi's incentive ecosystem boosted local output nine-fold over a decade, creating scale that reverberates across ASEAN exporting corridors. Fiber roll-outs and OTT content localisation bring first-time buyers in Indonesia, Vietnam and the Philippines into the smart TV market, expanding rural penetration.
North America is mature; replacement demand hinges on AI-powered upscaling and FAST-channel integration. Advertiser-funded services subsidise premium sets, and cloud-gaming latency improvements elevate refresh-rate specifications. Europe wrestles with stringent energy-efficiency law EC 2024/1781 that caps brightness for large 8 K models. Compliance forces thinner peak-luminance levels, prompting Mini-LED adoption and spurring R&D into micro-lens arrays.
Middle East and Africa trail with low single-digit penetration, yet infrastructure investments and rising disposable incomes signal headroom. Regional broadcasters rolling out Arabic-language FAST channels remove content barriers. Latin America shows bifurcated demand: premium sets sell into affluent urban districts, while low-cost streaming dongles slow panel upgrades in price-sensitive households. Throughout, currency volatility steers manufacturers toward flexible sourcing and hedging strategies to keep the smart TV market competitive.
- Samsung Electronics Co., Ltd.
- LG Electronics Inc.
- TCL Technology Group Corp.
- Hisense Group Co., Ltd.
- Xiaomi Corporation
- Sony Group Corporation
- Vizio Holding Corp.
- Panasonic Holdings Corporation
- Sharp Corporation
- TPV Technology Limited (Philips)
- Skyworth Group Ltd.
- Konka Group Co., Ltd.
- Haier Smart Home Co., Ltd.
- Changhong Electric Co., Ltd.
- Toshiba Corporation
- OnePlus Technology (Shenzhen) Co., Ltd.
- VU Technologies Pvt. Ltd.
Additional Benefits:
- The market estimate (ME) sheet in Excel format
- 3 months of analyst support
TABLE OF CONTENTS
1 INTRODUCTION
- 1.1 Study Assumptions and Market Definition
- 1.2 Scope of the Study
2 RESEARCH METHODOLOGY
3 EXECUTIVE SUMMARY
4 MARKET LANDSCAPE
- 4.1 Market Overview
- 4.2 Market Drivers
- 4.2.1 Price Erosion of 55-65" 4K Sets Accelerating Mass Adoption in India and Brazil
- 4.2.2 Telecom-Led Fiber Roll-outs Catalyzing First-Time Ownership in Southeast Asia
- 4.2.3 Integration of FAST Channels Spurring Upgrade Demand in North America
- 4.2.4 Government PLI and Localization Incentives Lowering ASPs in India
- 4.2.5 Cloud-Gaming Partnerships (Xbox, GeForce Now) Driving 120 Hz Premium TV Sales
- 4.2.6 Matter-Certified Interoperability Boosting Replacement Cycles in EU
- 4.3 Market Restraints
- 4.3.1 Semiconductor Tightness for MiniLED Backlights Limiting Premium Supply
- 4.3.2 Fragmented OS Ecosystem Raising App Development Costs
- 4.3.3 EU Tier-2 Energy Rules Curbing 8K TV Brightness and Adoption Rates
- 4.3.4 Low-Cost Streaming Dongles Extending Replacement Cycles in Price-Sensitive Markets
- 4.4 Industry Value Chain Analysis
- 4.5 Regulatory and Technological Outlook
- 4.6 Porter's Five Forces Analysis
- 4.6.1 Bargaining Power of Suppliers
- 4.6.2 Bargaining Power of Buyers
- 4.6.3 Threat of New Entrants
- 4.6.4 Threat of Substitutes
- 4.6.5 Competitive Rivalry
5 MARKET SIZE AND GROWTH FORECASTS (VALUES)
- 5.1 By Resolution
- 5.1.1 HD/Full HD
- 5.1.2 4K UHD
- 5.1.3 8K UHD
- 5.2 By Screen Size (Inches)
- 5.2.1 Upto 32
- 5.2.2 33-45
- 5.2.3 46-55
- 5.2.4 56-65
- 5.2.5 Above 65
- 5.3 By Panel/Display Technology
- 5.3.1 LED/LCD
- 5.3.2 OLED
- 5.3.3 QLED
- 5.3.4 Mini-LED
- 5.3.5 Micro-LED
- 5.4 By Screen Shape
- 5.4.1 Flat
- 5.4.2 Curved
- 5.5 By Operating System
- 5.5.1 Android TV
- 5.5.2 Other/OEM Proprietary
- 5.6 By Distribution Channel
- 5.6.1 Offline Retail (Hypermarket, Brand Stores)
- 5.6.2 Online (E-commerce, D2C)
- 5.7 By Geography
- 5.7.1 North America
- 5.7.1.1 United States
- 5.7.1.2 Canada
- 5.7.1.3 Mexico
- 5.7.2 Europe
- 5.7.2.1 Germany
- 5.7.2.2 United Kingdom
- 5.7.2.3 France
- 5.7.2.4 Nordics
- 5.7.2.5 Rest of Europe
- 5.7.3 South America
- 5.7.3.1 Brazil
- 5.7.3.2 Rest of South America
- 5.7.4 Asia-Pacific
- 5.7.4.1 China
- 5.7.4.2 Japan
- 5.7.4.3 India
- 5.7.4.4 South-East Asia
- 5.7.4.5 Rest of Asia-Pacific
- 5.7.5 Middle East and Africa
- 5.7.5.1 Middle East
- 5.7.5.1.1 Gulf Cooperation Council Countries
- 5.7.5.1.2 Turkey
- 5.7.5.1.3 Rest of Middle East
- 5.7.5.2 Africa
- 5.7.5.2.1 South Africa
- 5.7.5.2.2 Rest of Africa
- 5.7.1 North America
6 COMPETITIVE LANDSCAPE
- 6.1 Market Concentration
- 6.2 Strategic Moves
- 6.3 Market Share Analysis
- 6.4 Company Profiles {(includes Global level Overview, Market level overview, Core Segments, Financials as available, Strategic Information, Market Rank/Share for key companies, Products and Services, and Recent Developments)}
- 6.4.1 Samsung Electronics Co., Ltd.
- 6.4.2 LG Electronics Inc.
- 6.4.3 TCL Technology Group Corp.
- 6.4.4 Hisense Group Co., Ltd.
- 6.4.5 Xiaomi Corporation
- 6.4.6 Sony Group Corporation
- 6.4.7 Vizio Holding Corp.
- 6.4.8 Panasonic Holdings Corporation
- 6.4.9 Sharp Corporation
- 6.4.10 TPV Technology Limited (Philips)
- 6.4.11 Skyworth Group Ltd.
- 6.4.12 Konka Group Co., Ltd.
- 6.4.13 Haier Smart Home Co., Ltd.
- 6.4.14 Changhong Electric Co., Ltd.
- 6.4.15 Toshiba Corporation
- 6.4.16 OnePlus Technology (Shenzhen) Co., Ltd.
- 6.4.17 VU Technologies Pvt. Ltd.
7 MARKET OPPORTUNITIES AND FUTURE OUTLOOK
- 7.1 White-Space and Unmet-Need Assessment

