
PUBLISHER: Mordor Intelligence | PRODUCT CODE: 1850985

PUBLISHER: Mordor Intelligence | PRODUCT CODE: 1850985
Global Cancer Therapy - Market Share Analysis, Industry Trends & Statistics, Growth Forecasts (2025 - 2030)
The cancer therapy market is valued at USD 243.62 billion in 2025 and is forecast to expand to USD 403.99 billion by 2030, reflecting a 10.64% CAGR for 2025-2030.
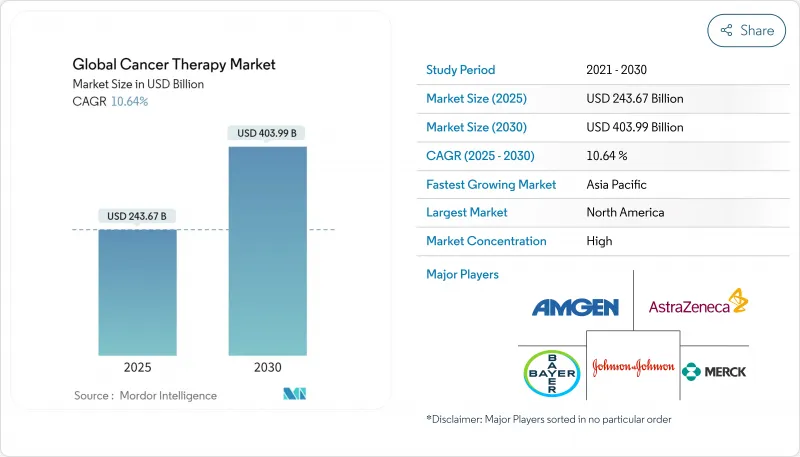
Advancing genomic profiling, faster tumor-agnostic approvals, and the expanding cell- and gene-therapy pipeline are propelling the cancer therapy market toward double-digit growth. Major pharmaceutical companies are prioritizing biomarker-driven portfolios, while Asia's healthcare investments accelerate regional uptake of innovative regimens. Regulatory agencies are also showing greater flexibility, enabling real-world evidence to shorten approval timelines. Despite these opportunities, the cancer therapy market faces supply-chain limits for viral vectors and persistent financial toxicity, both of which may temper near-term adoption rates.
Global Cancer Therapy Market Trends and Insights
Tumor-agnostic and biomarker-driven therapies
Approvals targeting genomic alterations rather than tissue of origin are reshaping clinical practice, with eight tumor-agnostic agents cleared by 2024, including fam-trastuzumab deruxtecan-nxki and repotrectinib. Real-world data show 21.5% of patients as potential candidates, widening the cancer therapy market and encouraging adaptive trial designs. Pharmaceutical firms now prioritize companion diagnostics at early development stages to align with these precision-medicine pathways and to reduce late-stage attrition risk. The approach is also catalyzing cross-tumor combination studies, which may further enlarge the addressable patient pool.
Cell & gene therapies accelerating pipeline growth
Investments in cell- and gene-based modalities jumped 30% in 2024 to USD 15.2 billion. More than 2,000 active trials and 3,000 developers underscore the modality's momentum. The February 2024 approval of lifileucel (Amtagvi) marked the first tumor-infiltrating lymphocyte therapy for solid tumors, achieving a 31.5% objective response. Thirteen of the 15 largest pharmaceutical firms now report dedicated CGT divisions, reflecting long-term commitment to this disruptive platform.
Escalating financial toxicity
Seventy-five percent of cancer patients seek copayment assistance, and 42.0% report severe financial strain. In leukemia, 75.0% of transplantation-eligible patients experience distress that can delay or curtail treatment. Younger adults with larger households are disproportionately affected, often reducing medication adherence. Few health systems offer systematic financial-distress screening, leaving room for policy interventions to safeguard access as high-cost regimens become standard of care.
Other drivers and restraints analyzed in the detailed report include:
- Real-world evidence fast-tracking regional access
- Companion diagnostics improve precision and speed
- Manufacturing capacity bottlenecks
For complete list of drivers and restraints, kindly check the Table Of Contents.
Segment Analysis
Targeted therapies commanded 37.0% of the cancer therapy market in 2024, reflecting strong clinician confidence in agents that inhibit specific molecular drivers. Eight tumor-agnostic approvals since 2017 anchor this dominance, while antibody-drug conjugates and tyrosine kinase inhibitors continue to expand indications. Immunotherapy is the fastest-growing segment, underpinned by breakthroughs such as lifileucel and CAR-T refinements. In contrast, chemotherapy's role is shifting toward combination backbone in precision regimens, reinforcing the evolution toward molecularly guided care.
The cancer therapy market size for immunotherapies is forecast to rise from USD 58 billion in 2024 to USD 120 billion by 2030, translating to a 14.9% CAGR. Checkpoint inhibitors lead unit sales, yet next-generation bispecific antibodies are adding incremental growth. Competitive intensity is high, with over 500 PD-1/L1 trials ongoing. Companies differentiate through novel targets (e.g., TIGIT, LAG-3) and subcutaneous formulations to extend brand life cycles.
Breast cancer treatments generated 18.2% of the cancer therapy market size in 2024, cementing the category's position as a bellwether for clinical innovation. Asia accounts for nearly half of global breast-cancer incidence, fueling region-specific trials on hormone-receptor-positive subtypes. Blood cancers follow, propelled by CAR-T and bispecific antibodies. The FDA's March 2025 approval of obecabtagene autoleucel, which delivered a 63% complete-remission rate in refractory B-cell ALL, illustrates the transformative potential of cell therapies.
In lung cancer, ALK, EGFR, and ROS1 test positivity rates now dictate first-line choice, anchoring a steady shift from empirical chemotherapy to genotype-matched regimens. Tumor mutational burden and KRAS G12C targeting further broaden the precision oncology toolkit, sustaining demand growth in this high-incidence segment of the cancer therapy market.
The Cancer Therapy Market Report is Segmented by Therapy Type (Chemotherapy, Targeted Therapy, Immunotherapy, and More), Cancer Type (Blood Cancer, Breast Cancer, Prostate Cancer, and More), Route of Administration (Intravenous, Oral, and More), End User (Hospitals, Specialty Clinics, and More), and Geography (North America, Europe, Asia-Pacific, and More). The Market Forecasts are Provided in Terms of Value (USD).
Geography Analysis
North America accounted for 43.0% of the cancer therapy market in 2024, supported by deep clinical-trial pipelines and broad insurance coverage. The United States has led in first-in-class approvals, with FDA clearing 29 oncology applications during 2024 alone. Even so, patient out-of-pocket costs often exceed 20% of household income, intensifying public debate on value-based pricing.
Asia is the fastest-growing region, with the cancer therapy market expected to post an 11.2% CAGR to 2030. China's oncology research output now surpasses that of the United States. Government incentives, such as priority review vouchers and centralized procurement reforms, aim to accelerate local innovation while containing price inflation. Southeast Asia anticipates 2.03 million new cases annually by 2050, underscoring pressing needs for screening programs and broader molecular testing access.
Europe retains a sizeable share of the cancer therapy industry, aided by universal health systems and collaborative research networks. The European Medicines Agency recently issued harmonized guidance on CDx assessment, facilitating precision-medicine rollouts. Meanwhile, the Middle East, Africa, and South America comprise emerging clusters. These markets invest in technology-transfer partnerships to boost local manufacturing of biologics, thereby enhancing affordability and supply resilience.
- Roche
- Bristol-Myers Squibb
- Johnson & Johnson Services Inc. (Janssen)
- Merck
- AstraZeneca
- Novartis
- Pfizer
- Amgen
- Abbvie
- GlaxoSmithKline
- Takeda Pharmaceuticals
- Astellas Pharma
- Gilead Sciences
- Seagen
- Regeneron Pharmaceuticals
- BeiGene Ltd.
- Exelixis, Inc.
- Eli Lilly and Company
- Celldex Therapeutic
- Alaunos Therapeutics Inc.
Additional Benefits:
- The market estimate (ME) sheet in Excel format
- 3 months of analyst support
TABLE OF CONTENTS
1 Introduction
- 1.1 Study Assumptions & Market Definition
- 1.2 Scope of the Study
2 Research Methodology
3 Executive Summary
4 Market Landscape
- 4.1 Market Overview
- 4.2 Market Drivers
- 4.2.1 Accelerating Adoption of Tumor-Agnostic & Biomarker-Driven Therapies
- 4.2.2 Expansion of Cell & Gene Therapies Pipeline Crossing 2,000 Active Clinical Trials Globally
- 4.2.3 Rising Utilization of Real-World Evidence to Secure Accelerated Approvals in Japan and China
- 4.2.4 Surge in Companion Diagnostic Co-Launches Reducing Time-to-Market for Targeted Drugs
- 4.2.5 Oncology Drug Bundling Models Gaining Traction in US Commercial Payer Systems
- 4.2.6 Contract Development & Manufacturing Expansion in APAC Driving Cost-Effective Production
- 4.3 Market Restraints
- 4.3.1 Escalating Financial Toxicity Leading to Treatment Abandonment
- 4.3.2 Manufacturing Capacity Bottlenecks for Viral Vectors Limiting Cell Therapy Supply
- 4.3.3 Divergent HTA Value Assessment Criteria Delaying Market Access
- 4.3.4 Immunotherapy Resistance Mechanisms Undermining Long-Term Efficacy in Solid Tumors
- 4.4 Regulatory Outlook
- 4.5 Technological Outlook
- 4.6 Porter's Five Forces Analysis
- 4.6.1 Threat of New Entrants
- 4.6.2 Bargaining Power of Buyers
- 4.6.3 Bargaining Power of Suppliers
- 4.6.4 Threat of Substitute Products
- 4.6.5 Intensity of Competitive Rivalry
5 Market Size & Growth Forecasts (Value, USD)
- 5.1 By Therapy Type
- 5.1.1 Chemotherapy
- 5.1.2 Targeted Therapy
- 5.1.3 Immunotherapy
- 5.1.4 Hormonal Therapy
- 5.1.5 Other Treatment Types
- 5.2 By Cancer Type
- 5.2.1 Blood Cancer
- 5.2.2 Breast Cancer
- 5.2.3 Prostate Cancer
- 5.2.4 Gastrointestinal Cancer
- 5.2.5 Gynecologic Cancer
- 5.2.6 Respiratory/Lung Cancer
- 5.2.7 Other Cancer Types
- 5.3 By Route of Administration
- 5.3.1 Intravenous
- 5.3.2 Oral
- 5.3.3 Subcutaneous
- 5.3.4 Intratumoral
- 5.4 By End User
- 5.4.1 Hospitals
- 5.4.2 Specialty Clinics
- 5.4.3 Cancer and Radiation Therapy Centers
- 5.4.4 Homecare Settings
- 5.5 By Geography
- 5.5.1 North America
- 5.5.1.1 United States
- 5.5.1.2 Canada
- 5.5.1.3 Mexico
- 5.5.2 Europe
- 5.5.2.1 Germany
- 5.5.2.2 United Kingdom
- 5.5.2.3 France
- 5.5.2.4 Italy
- 5.5.2.5 Spain
- 5.5.2.6 Rest of Europe
- 5.5.3 Asia-Pacific
- 5.5.3.1 China
- 5.5.3.2 Japan
- 5.5.3.3 India
- 5.5.3.4 South Korea
- 5.5.3.5 Australia
- 5.5.3.6 Rest of Asia-Pacific
- 5.5.4 Middle-East and Africa
- 5.5.4.1 GCC
- 5.5.4.2 South Africa
- 5.5.4.3 Rest of Middle East and Africa
- 5.5.5 South America
- 5.5.5.1 Brazil
- 5.5.5.2 Argentina
- 5.5.5.3 Rest of South America
- 5.5.1 North America
6 Competitive Landscape
- 6.1 Market Concentration
- 6.2 Strategic Moves
- 6.3 Market Share Analysis
- 6.4 Company Profiles (includes Global level Overview, Market level overview, Core Business Segments, Financials, Headcount, Key Information, Market Rank, Market Share, Products and Services, and analysis of Recent Developments)
- 6.4.1 F. Hoffmann-La Roche AG
- 6.4.2 Bristol Myers Squibb Company
- 6.4.3 Johnson & Johnson Services Inc. (Janssen)
- 6.4.4 Merck & Co., Inc.
- 6.4.5 AstraZeneca PLC
- 6.4.6 Novartis AG
- 6.4.7 Pfizer Inc.
- 6.4.8 Amgen Inc.
- 6.4.9 AbbVie Inc.
- 6.4.10 GSK PLC
- 6.4.11 Takeda Pharmaceutical Company Limited
- 6.4.12 Astellas Pharma Inc.
- 6.4.13 Gilead Sciences Inc. (Kite Pharma)
- 6.4.14 Seagen Inc.
- 6.4.15 Regeneron Pharmaceuticals, Inc.
- 6.4.16 BeiGene Ltd.
- 6.4.17 Exelixis, Inc.
- 6.4.18 Eli Lilly and Company
- 6.4.19 Celldex Therapeutics Inc.
- 6.4.20 Alaunos Therapeutics Inc.
7 Market Opportunities & Future Outlook
- 7.1 White-Space & Unmet-Need Assessment

