
PUBLISHER: Mordor Intelligence | PRODUCT CODE: 1850987

PUBLISHER: Mordor Intelligence | PRODUCT CODE: 1850987
3PL - Market Share Analysis, Industry Trends & Statistics, Growth Forecasts (2025 - 2030)
The 3PL market size is valued at USD 1.15 trillion in 2025 and is forecast to climb to USD 1.48 trillion by 2030, delivering a steady 5.18% CAGR over the period.
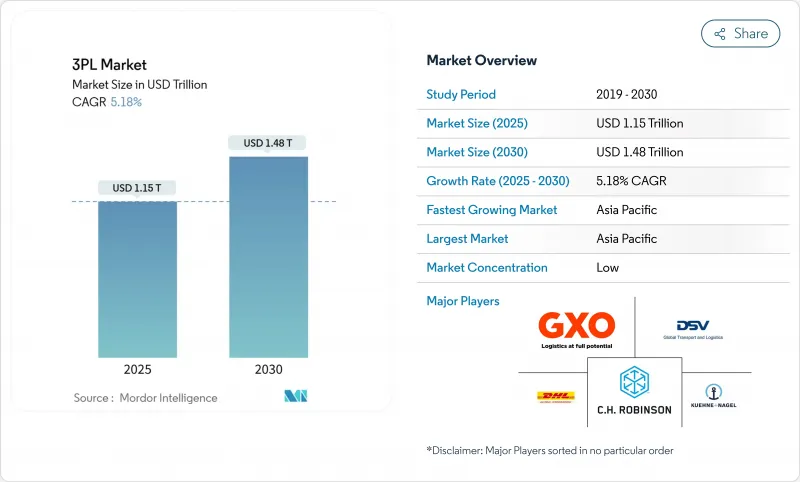
Close to 55% of current revenue sits with asset-light providers that orchestrate networks through partners rather than owning fleets or warehouses. This model reduces capital risk and lets operators flex capacity when trade flows swing. Asia-Pacific anchors the global 3PL market with 41.3% of revenue, propelled by e-commerce expansion and outward shifts in manufacturing that draw production to India, Vietnam, and Indonesia. Technology remains the decisive lever: providers that integrate real-time visibility, digital freight matching, and warehouse automation gain speed and cost advantages hard for slower rivals to match. Near-shoring into Mexico, green logistics mandates in Europe, and specialized life-science flows in North America together tighten service requirements, pushing the sector toward shorter contracts and deeper investment in data-rich platforms.
Global 3PL Market Trends and Insights
E-commerce scale-up accelerating same-day fulfillment
Online retail in emerging economies is rapidly growing, and shoppers are increasingly expecting delivery in hours rather than days. Providers answer by planting hyperlocal hubs beside dense neighborhoods, trimming linehaul distance, and raising delivery density. These shifts force 3PL market operators to fine-tune route planning engines, expand two-wheeler fleets for congested streets, and adopt cloud order-management capable of real-time slot scheduling. Capital flows follow the demand: specialty real-estate trusts are converting small city plots into multi-story micro-fulfillment sites outfitted with shuttle systems and collaborative robots.
OEM near-shoring strategies creating cross-border shuttle freight
Mexico surpassed China as the United States' top trading partner between 2022 and 2023, handling USD 475.6 billion in goods and driving roughly 20,900 loaded truck crossings each month. New industrial parks under construction near Monterrey and along the Bajio corridor will keep freight taps open well past 2025. Shuttle lanes-short, high-frequency loops linking supplier plants to U.S. distribution centers-now underpin annual contracts for dedicated tractors, trailers, and dray service on both sides of the border. 3PL market leaders add bilingual control towers, real-time border-wait tracking, and dual-compliance customs brokerage to squeeze dwell times. Rail-truck intermodal pairings are rising too, reducing CO2 emissions per move and locking in predictable transit schedules.
Port congestion-induced cost volatility
Backlogs at major gateways spur wide swings in ocean spot rates and chassis detention fees. Shippers now prefer rolling quarterly agreements instead of multi-year pacts, keeping room to maneuver when port dwell blows out. 3PL market providers hedge by securing overflow yard space inland and deploying pop-up trans-load sites to flip cargo to rail the same day. Real-time data feeds from terminal operating systems guide dynamic slot booking, so trucks arrive only when a container sits wheels-ready.
Other drivers and restraints analyzed in the detailed report include:
- Pharmaceutical cold-chain outsourcing surge
- Government green-logistics mandates boosting carbon-neutral solutions
- Driver and warehouse labor scarcity
For complete list of drivers and restraints, kindly check the Table Of Contents.
Segment Analysis
Domestic Transportation Management captured 45% of the 3PL market size in 2024-equal to nearly USD 522 billion-and is forecast to grow 5.9% annually through 2030. App-based freight platforms feed real-time prices into tender engines, raising primary acceptance rates and shaving empty-mile percentages. The launch of same-day e-commerce routes and regionalized micro-fulfillment footprints intensifies demand for point-to-point linehauls and milk-run collections inside national borders.
The 3PL market also sees International Transportation Management weather softer growth as geopolitical risk and volatile ocean schedules complicate planning. Value-Added Warehousing and Distribution gains from inventory decentralization: retailers place stock closer to customer clusters, pushing operators to retrofit buildings with high-density shuttle racking and on-site returns processing lines. Road remains the dominant mode, but intermodal rails capture share on lanes longer than 900 kilometers where reliability now rivals trucking.
The 3PL Market Report is Segmented by Service (Domestic Transportation Management, International Transportation Management, and More), by End User (Automotive, Energy and Utilities, Manufacturing and More), by Logistics Model (Asset-Light, Asset-Heavy, and Hybrid), by Region (North America, South America, Europe, Asia-Pacific and More). The Market Forecasts are Provided in Terms of Value (USD).
Geography Analysis
Asia-Pacific retains 41.3% of 3PL market revenue and posts a region-best 6.0% CAGR. Manufacturing bases continue to diversify beyond China, sparking multimodal corridors from Ho Chi Minh City to Bangkok and onward to deepwater ports. Digital customs platforms in Singapore cut clearance time to under two hours, while Indonesia's e-commerce parcel volumes have tripled since 2022, demanding new automated sortation centers. Capital projects under Japan's Green Ports plan add cold-chain berth space, enabling direct imports of vaccine payloads.
North America ranks second in the 3PL market size and is being reshaped by near-shoring. Laredo, Texas, now hosts more warehouse stock than the Port of Savannah as shippers stage goods for rapid continental distribution. Short-haul intermodal chains reduce empty chassis runs, and unified rail service via the CPKC network trims single-crossing transit by a full day. Driver shortages push fleets toward slip-seat scheduling and remote-controlled yard tractors, lifting asset turns while saving labor hours.
Europe's 3PL market wrestles with emissions costs under the expanded EU Emissions Trading System. Shipping lines must purchase allowances covering 70% of vessel output in 2025, nudging cargo from ocean to rail on short-sea routes where electric locomotives claim zero-emission credits. The FuelEU Maritime and ReFuelEU Aviation regulations add further discipline, compelling carriers to blend low-carbon fuels. Providers that document certified reductions secure contracts with brands under pressure to meet climate disclosures.
- DHL Supply Chain and Global Forwarding
- Kuehne + Nagel International AG
- GXO Logistics
- C.H. Robinson Worldwide Inc.
- DSV A/S
- Nippon Express Holdings
- Sinotrans Ltd.
- CEVA Logistics (CMA CGM)
- XPO Logistics Inc.
- FedEx Logistics
- UPS Supply Chain Solutions
- GEODIS
- Kerry Logistics Network
- Yusen Logistics (NYK)
- Hitachi Transport System (LOGISTEED)
- J.B. Hunt Transport Services Inc.
- CJ Logistics
- Samsung SDS
- Americold Logistics LLC
- Penske Logistics
- Expeditors
Additional Benefits:
- The market estimate (ME) sheet in Excel format
- 3 months of analyst support
TABLE OF CONTENTS
1 Introduction
- 1.1 Study Assumptions and Market Definition
- 1.2 Scope of the Study
2 Research Methodology
3 Executive Summary
4 Market Landscape
- 4.1 Market Overview
- 4.2 Market Drivers
- 4.2.1 E-commerce Scale-up Accelerating Same-Day Fulfilment Demands in Developing Countries
- 4.2.2 OEM Near-shoring Strategies Creating Cross-Border Shuttle Freight Opportunities in North America
- 4.2.3 Pharmaceutical Cold-Chain Outsourcing Surge in Developed Economies
- 4.2.4 Government Green-Logistics Mandates (e.g., EU Fit-for-55) Boosting 3PL Demand for Carbon-Neutral Solutions
- 4.2.5 High-tech Sector's Shift to Direct-to-Consumer (D2C) Models Requiring Multi-Tenant DCs
- 4.2.6 Rise of Omni-channel Grocery Driving Micro-Fulfilment Contracts in Urban Zones
- 4.3 Market Restraints
- 4.3.1 Port Congestion-Induced Cost Volatility Reducing Contract Durations
- 4.3.2 Driver and Warehouse Labor Scarcity in OECD Economies Inflating Operating Margins
- 4.3.3 Soaring Industrial Real-Estate Costs in Tier-1 Logistics Hubs Compressing 3PL Margins
- 4.3.4 Cross-border Data-Residency Rules Limiting Cloud WMS Roll-outs
- 4.4 Value / Supply-Chain Analysis
- 4.5 Technology Snapshot (IoT, AI, etc.)
- 4.6 Key Government Regulations and Initiatives
- 4.7 Insights into E-commerce Business
- 4.8 Warehousing Market Trends
- 4.9 Demand Trend Analysis (CEP, Last-Mile, Cold-Chain etc.)
- 4.10 Porter's Five Forces
- 4.10.1 Threat of New Entrants
- 4.10.2 Bargaining Power of Buyers
- 4.10.3 Bargaining Power of Suppliers
- 4.10.4 Threat of Substitutes
- 4.10.5 Intensity of Competitive Rivalry
- 4.11 Impact of Geopolitical Events on the Market
5 Market Size & Growth Forecasts (Value)
- 5.1 By Service
- 5.1.1 Domestic Transportation Management (DTM)
- 5.1.1.1 Roadways
- 5.1.1.2 Railways
- 5.1.1.3 Airways
- 5.1.1.4 Waterways
- 5.1.2 International Transportation Management (ITM)
- 5.1.2.1 Roadways
- 5.1.2.2 Railways
- 5.1.2.3 Airways
- 5.1.2.4 Waterways
- 5.1.3 Value-Added Warehousing and Distribution (VAWD)
- 5.1.1 Domestic Transportation Management (DTM)
- 5.2 By End User
- 5.2.1 Automotive
- 5.2.2 Energy and Utilities
- 5.2.3 Manufacturing
- 5.2.4 Life Sciences and Healthcare
- 5.2.5 Technology and Electronics
- 5.2.6 Retail and E-commerce
- 5.2.7 Consumer Goods and FMCG
- 5.2.8 Food and Beverages
- 5.2.9 Others
- 5.3 By Logistics Model
- 5.3.1 Asset-Light (Management-Based)
- 5.3.2 Asset-Heavy (Own Fleet and Warehouses)
- 5.3.3 Hybrid
- 5.4 By Region
- 5.4.1 North America
- 5.4.1.1 United States
- 5.4.1.2 Canada
- 5.4.1.3 Mexico
- 5.4.2 South America
- 5.4.2.1 Brazil
- 5.4.2.2 Argentina
- 5.4.2.3 Chile
- 5.4.2.4 Rest of South America
- 5.4.3 Europe
- 5.4.3.1 Germany
- 5.4.3.2 United Kingdom
- 5.4.3.3 France
- 5.4.3.4 Spain
- 5.4.3.5 Italy
- 5.4.3.6 Netherlands
- 5.4.3.7 Russia
- 5.4.3.8 Rest of Europe
- 5.4.4 Asia-Pacific
- 5.4.4.1 China
- 5.4.4.2 India
- 5.4.4.3 Japan
- 5.4.4.4 South Korea
- 5.4.4.5 Singapore
- 5.4.4.6 Vietnam
- 5.4.4.7 Indonesia
- 5.4.4.8 Australia
- 5.4.4.9 Rest of Asia-Pacific
- 5.4.5 Middle East
- 5.4.5.1 United Arab Emirates
- 5.4.5.2 Saudi Arabia
- 5.4.5.3 Turkey
- 5.4.5.4 Israel
- 5.4.5.5 Rest of Middle East
- 5.4.6 Africa
- 5.4.6.1 South Africa
- 5.4.6.2 Egypt
- 5.4.6.3 Nigeria
- 5.4.6.4 Kenya
- 5.4.6.5 Rest of Africa
- 5.4.1 North America
6 Competitive Landscape
- 6.1 Strategic Moves
- 6.2 Market Share Analysis
- 6.3 Company Profiles (includes Global level Overview, Market level overview, Core Segments, Financials as available, Strategic Information, Market Rank/Share for key companies, Products and Services, and Recent Developments)
- 6.3.1 DHL Supply Chain and Global Forwarding
- 6.3.2 Kuehne + Nagel International AG
- 6.3.3 GXO Logistics
- 6.3.4 C.H. Robinson Worldwide Inc.
- 6.3.5 DSV A/S
- 6.3.6 Nippon Express Holdings
- 6.3.7 Sinotrans Ltd.
- 6.3.8 CEVA Logistics (CMA CGM)
- 6.3.9 XPO Logistics Inc.
- 6.3.10 FedEx Logistics
- 6.3.11 UPS Supply Chain Solutions
- 6.3.12 GEODIS
- 6.3.13 Kerry Logistics Network
- 6.3.14 Yusen Logistics (NYK)
- 6.3.15 Hitachi Transport System (LOGISTEED)
- 6.3.16 J.B. Hunt Transport Services Inc.
- 6.3.17 CJ Logistics
- 6.3.18 Samsung SDS
- 6.3.19 Americold Logistics LLC
- 6.3.20 Penske Logistics
- 6.3.21 Expeditors
7 Market Opportunities and Future Outlook
- 7.1 White-space and Unmet-Need Assessment
- 7.2 Emergence of 4PL and Digital Freight Marketplaces
- 7.3 Sustainability and Green Logistics Initiatives
- 7.4 Automation and Robotics in Warehouses
- 7.5 Near-shoring and Regionalisation Impact on Contract Structures

