
PUBLISHER: Mordor Intelligence | PRODUCT CODE: 1851091

PUBLISHER: Mordor Intelligence | PRODUCT CODE: 1851091
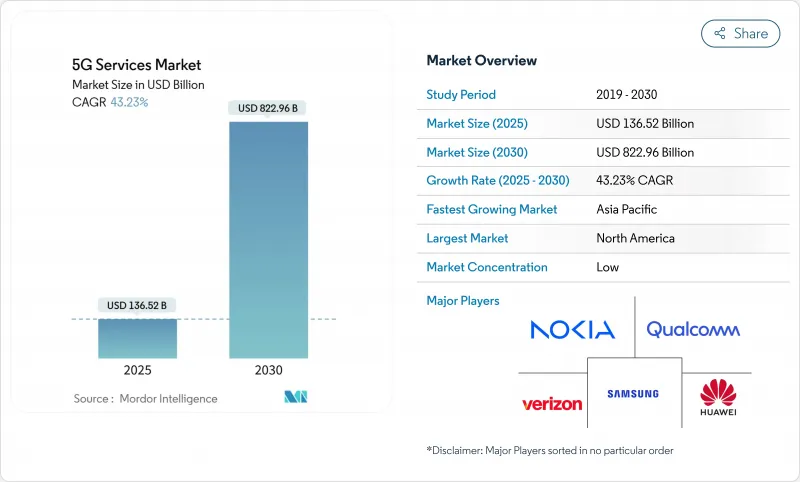
5G Services - Market Share Analysis, Industry Trends & Statistics, Growth Forecasts (2025 - 2030)
The 5G services market generated USD 136.52 billion in 2025 and is forecast to reach USD 822.96 billion by 2030, reflecting a 43.23% CAGR.
Standalone 5G rollouts, the commercial debut of network slicing, and a rapid shift from consumer to enterprise use cases underpin this expansion.Operators are moving away from traffic-based billing and toward experience-based pricing that charges premiums for assured latency, throughput, and security levels, boosting average revenue per user in industrial verticals. Manufacturing, healthcare, and logistics are adopting private 5G networks to support real-time automation, predictive maintenance, and remote operations-use cases that cannot be handled by legacy Wi-Fi. Asia Pacific retains technology leadership through aggressive spectrum releases and large-scale 5G-Advanced deployments, while North America leverages a deep mid-band spectrum pool to accelerate fixed wireless access (FWA) adoption.
Global 5G Services Market Trends and Insights
Enterprise Digital-Transformation Use Cases
Key Highlights
- Mobile-data traffic rose 38% year-on-year in 2024 and is tracking toward an eight-fold increase by 2030, straining 4 G networks and driving migration to 5 G mid-band spectrum. Video streaming already consumes more than 70% of cellular bandwidth, encouraging operators to off-load traffic to 5G stand-alone cores where higher spectral efficiency lowers cost per bit. eMBB services now average 38 GB per subscriber each month in South Korea, a figure that would saturate legacy radios. The 5G services market benefits because service providers can tier unlimited-data plans at higher price points while still reducing the cost per gigabyte. As smartphone processors and displays improve, 4K mobile video, cloud gaming, and XR-based entertainment will amplify traffic, reinforcing the 8.5% uplift in forecast CAGR.
Monetization via Network Slicing and SLA Tiers
Commercial 5 G networks deliver median download speeds of 225 Mbps in the United States and 405 Mbps in China, well above 4 G records. Consumers now expect consistent 4K streaming and low-latency gaming, prompting carriers to launch premium-speed tiers that add USD 5-10 to monthly ARPU in developed markets. Handset vendors shipped 280 million 5 G-capable smartphones in 2024, 81% of the flagship segment, cementing mass-market readiness. Operators monetize this appetite with speed-based plans and bundled cloud-gaming passes, producing the 6.2% CAGR lift attributed to eMBB demand. Stadiums, concert venues, and transportation hubs increasingly rely on 5 G small cells to sustain dense traffic, proving early willingness to pay for predictable throughput.
High Deployment Cost and Long ROI Horizons
Operators face steep capital commitments: a single 5G base-station costs USD 100,000-200,000, with millimeter-wave units up to twice as expensive. Global 5G infrastructure spend will top USD 1.1 trillion in 2025, yet breakeven is often eight to ten years, stretching balance sheets in price-sensitive regions. Energy outlays are also rising; some operators report 23% hikes in electricity bills even after adopting power-saving software. These pressures spur cost-sharing deals such as KDDI and SoftBank's joint network build in Japan, which aims to lower expenses by 30-40% through site co-location. Mergers like T-Mobile's USD 4.4 billion acquisition of UScellular reinforce the quest for scale economies.
Other drivers and restraints analyzed in the detailed report include:
- Enterprise Digital-Transformation Use Cases
- Government Spectrum-Release Initiatives
- Limited 5G Device Readiness in Emerging Markets
For complete list of drivers and restraints, kindly check the Table Of Contents.
Segment Analysis
Enhanced mobile broadband contributed 64.20% to the 5G services market in 2024, reflecting its foundational role in consumer video and gaming. Ultra-reliable low-latency communications is forecast to deliver a 60.30% CAGR, buoyed by manufacturing automation and telesurgery, which depend on sub-millisecond latency. Massive machine-type communications is gaining traction in smart-city grids, with cellular IoT links predicted to hit 7.5 billion by 2033, according to Mobile World Live.
URLLC drives premium monetization because industries will pay to ensure deterministic performance. The 5G services market size for URLLC applications is projected to capture a high-single-digit share by 2030 as hospital networks adopt robotic-surgery links. Standardization of RedCap and eRedCap devices keeps IoT chipset costs down, hastening commercial readiness for simplified industrial sensors. Network slicing allocates dedicated bandwidth to low-data-rate devices, improving battery life and predictability for logistics firms.
The 5G Service Market Report is Segmented by Service Type (Enhanced Mobile Broadband (eMBB), Ultra-Reliable Low-Latency Comms (URLLC), and More), Network Architecture (Non-Standalone (NSA) 5G and Standalone (SA) 5G), End-User Industry (IT and Telecom, Media and Entertainment, Automotive and Mobility, and More), and Geography. The Market Forecasts are Provided in Terms of Value (USD).
Geography Analysis
Asia Pacific generated 42.00% of global revenue in 2024 and is on track for a 56.42% CAGR, the fastest among all regions. China Unicom Beijing and Huawei activated a 5G-Advanced network covering 10 million people, highlighting an ecosystem that blends spectrum access, low-cost hardware, and tight vendor-operator collaboration huawei.com. India's FWA market aims for 30 million users by 2027, reflecting unmet fixed-broadband demand in a nation where only 11% of households enjoy wired access.
North America already records 90% 5G subscription penetration forecasts for 2027, driven by abundant mid-band spectrum and aggressive FWA scaling. T-Mobile's 6.43 million FWA customers and Verizon's 4.3 million illustrate how wireless has become a mainstream alternative to fiber. Canada's Rogers performed the region's first network-slicing trial, paving the way for guaranteed service to enterprises.
Europe lags in standalone coverage, with only 2% SA availability in late 2024. Yet Germany, the UK, and Spain accelerate deployment, while the USD 20.28 billion Vodafone-Three merger promises deeper capital pools for SA rollouts. In the Middle East and Africa, Egypt invested USD 609 million to prepare for 2025 launches, and South Africa reaches over 50% population coverage with 10.8 million users. Latin America is steadily expanding, with Brazil's commercial 5G live in 1,300 cities and Costa Rica allocating spectrum across four bands in February 2025.
- China Mobile Ltd.
- Verizon Communications Inc.
- ATandT Inc.
- T-Mobile US Inc.
- China Telecom Corp. Ltd.
- Telefonaktiebolaget LM Ericsson
- Nokia Corp.
- Huawei Technologies Co. Ltd.
- Deutsche Telekom AG
- Vodafone Group Plc
- Orange S.A.
- Telefonica S.A.
- BT Group plc
- Swisscom AG
- Telstra Corp. Ltd.
- SK Telecom Co. Ltd.
- KT Corp.
- Rakuten Mobile Inc.
- Reliance Jio Infocomm Ltd.
- Qualcomm Inc. (5G as-a-Service platforms)
- Samsung Electronics Co. Ltd. (5G networks)
Additional Benefits:
- The market estimate (ME) sheet in Excel format
- 3 months of analyst support
TABLE OF CONTENTS
1 INTRODUCTION
- 1.1 Study Assumptions and Market Definition
- 1.2 Scope of the Study
2 RESEARCH METHODOLOGY
3 EXECUTIVE SUMMARY
4 MARKET INSIGHTS
- 4.1 Market Overview
- 4.2 Market Drivers
- 4.2.1 Exploding mobile data traffic
- 4.2.2 High consumer demand for eMBB services
- 4.2.3 Enterprise digital-transformation use-cases
- 4.2.4 Government spectrum-release initiatives
- 4.2.5 Private-5G uptake in CBRS and local-licence bands
- 4.2.6 Monetisation via network slicing and SLA tiers
- 4.3 Market Restraints
- 4.3.1 High deployment cost and long ROI horizons
- 4.3.2 Fragmented and delayed spectrum policy
- 4.3.3 Limited 5G device readiness in emerging markets
5 MARKET DYNAMICS
- 5.1 Value Chain Analysis
- 5.2 Regulatory Landscape
- 5.3 Technological Outlook
- 5.4 Porter's Five Forces Analysis
- 5.4.1 Threat of New Entrants
- 5.4.2 Bargaining Power of Buyers
- 5.4.3 Bargaining Power of Suppliers
- 5.4.4 Threat of Substitutes
- 5.4.5 Intensity of Competitive Rivalry
6 MARKET SIZE AND GROWTH FORECASTS (VALUE)
- 6.1 By Service Type
- 6.1.1 Enhanced Mobile Broadband (eMBB)
- 6.1.2 Ultra-Reliable Low-Latency Comms (URLLC)
- 6.1.3 Massive Machine-Type Comms (mMTC)
- 6.2 By Network Architecture
- 6.2.1 Non-Standalone (NSA) 5G
- 6.2.2 Standalone (SA) 5G
- 6.3 By End-User Industry
- 6.3.1 IT and Telecom
- 6.3.2 Media and Entertainment
- 6.3.3 Automotive and Mobility
- 6.3.4 Energy and Utilities
- 6.3.5 Aerospace and Defense
- 6.3.6 Manufacturing
- 6.3.7 Healthcare
- 6.3.8 Other Industries
- 6.4 By Geography
- 6.4.1 North America
- 6.4.1.1 United States
- 6.4.1.2 Canada
- 6.4.1.3 Mexico
- 6.4.2 South America
- 6.4.2.1 Brazil
- 6.4.2.2 Argentina
- 6.4.2.3 Rest of South America
- 6.4.3 Europe
- 6.4.3.1 Germany
- 6.4.3.2 United Kingdom
- 6.4.3.3 France
- 6.4.3.4 Italy
- 6.4.3.5 Russia
- 6.4.3.6 Rest of Europe
- 6.4.4 Asia Pacific
- 6.4.4.1 China
- 6.4.4.2 India
- 6.4.4.3 Japan
- 6.4.4.4 South Korea
- 6.4.4.5 ASEAN
- 6.4.4.6 Rest of Asia Pacific
- 6.4.5 Middle East and Africa
- 6.4.5.1 Middle East
- 6.4.5.1.1 Saudi Arabia
- 6.4.5.1.2 UAE
- 6.4.5.1.3 Turkey
- 6.4.5.1.4 Rest of Middle East
- 6.4.5.2 Africa
- 6.4.5.2.1 South Africa
- 6.4.5.2.2 Nigeria
- 6.4.5.2.3 Rest of Africa
- 6.4.1 North America
7 COMPETITIVE LANDSCAPE
- 7.1 Market Concentration
- 7.2 Strategic Moves
- 7.3 Market Share Analysis
- 7.4 Company Profiles {(includes Global level Overview, Market level overview, Core Segments, Financials as available, Strategic Information, Market Rank/Share for key companies, Products and Services, and Recent Developments)}
- 7.4.1 China Mobile Ltd.
- 7.4.2 Verizon Communications Inc.
- 7.4.3 ATandT Inc.
- 7.4.4 T-Mobile US Inc.
- 7.4.5 China Telecom Corp. Ltd.
- 7.4.6 Telefonaktiebolaget LM Ericsson
- 7.4.7 Nokia Corp.
- 7.4.8 Huawei Technologies Co. Ltd.
- 7.4.9 Deutsche Telekom AG
- 7.4.10 Vodafone Group Plc
- 7.4.11 Orange S.A.
- 7.4.12 Telefonica S.A.
- 7.4.13 BT Group plc
- 7.4.14 Swisscom AG
- 7.4.15 Telstra Corp. Ltd.
- 7.4.16 SK Telecom Co. Ltd.
- 7.4.17 KT Corp.
- 7.4.18 Rakuten Mobile Inc.
- 7.4.19 Reliance Jio Infocomm Ltd.
- 7.4.20 Qualcomm Inc. (5G as-a-Service platforms)
- 7.4.21 Samsung Electronics Co. Ltd. (5G networks)
8 MARKET OPPORTUNITIES AND FUTURE OUTLOOK
- 8.1 White-space and Unmet-need Assessment

