
PUBLISHER: Mordor Intelligence | PRODUCT CODE: 1851134

PUBLISHER: Mordor Intelligence | PRODUCT CODE: 1851134
Media And Entertainment - Market Share Analysis, Industry Trends & Statistics, Growth Forecasts (2025 - 2030)
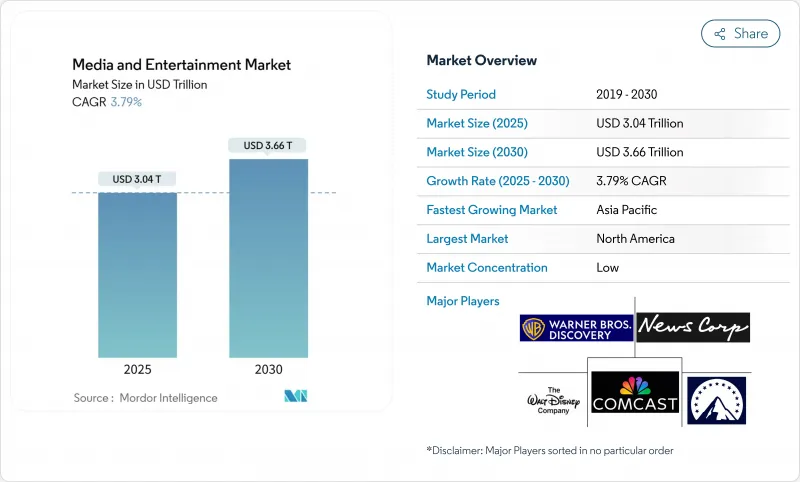
The Media and Entertainment market size is estimated at USD 3.04 trillion in 2025 and is projected to reach USD 3.66 trillion by 2030, advancing at a steady 3.79% CAGR from 2025 to 2030.
Mobile advertising, live-streaming, and subscription video together represent almost one-half of current receipts, while legacy broadcast, cinema, and print continue to cede share yet still contribute library content that feeds high-margin licensing deals. Cash flow is becoming less seasonal because subscription renewals smooth the traditional peaks and troughs tied to upfront advertising calendars. Companies that combine direct-to-consumer distribution with proprietary ad stacks show stronger credit outlooks, which helps them finance longer production pipelines at lower borrowing costs. Consumer attention is fragmenting across platforms faster than revenue line growth suggests; short-form viewing on social feeds expanded sharply in high-penetration 5 G territories, while long-form services maintained viewing time by inserting mid-roll ads that feel native rather than disruptive.
Global Media And Entertainment Market Trends and Insights
Proliferation of 5 G-Enabled Mobile Video Consumption in Asia
Mobile video traffic in South Korea jumped 58% year on year during Q1 2025 after nationwide 5 G coverage became commonplace . Average session length rose from 22 minutes to 35 minutes, giving platforms extra pre-roll and mid-roll inventory. Compression-focused apps lowered data fees and redirected savings toward premium short-form rights, strengthening negotiating power with rights owners. Advertisers testing six-second commerce clips reported cart conversions comparable with desktop display, proving the smartphone can serve both brand-building and checkout functions. The Media and Entertainment market, therefore, benefits from richer monetisation levers per minute of viewing, encouraging studios to allocate more budget to mobile-first franchises.
Surging Connected-TV Ad Spend by United States Retail Brands
One large U.S. retailer more than doubled connected-TV (CTV) spend over the twelve months to April 2025 , corporate.walmart.com. By linking loyalty-card data to CTV exposure, the firm confirmed that targeted households spent USD 6.80 more per grocery basket than control groups. Shoppable overlays on smart TVs pushed click-through rates up almost 30% in parallel e-commerce campaigns, motivating brands to migrate budgets from linear television to streaming. Because device manufacturers now run their ad exchanges, they negotiate multi-year volume guarantees that stabilise fill rates. The Media and Entertainment market gains a higher share of retail media budgets as a direct result.
Heightened EU Scrutiny on Targeted Digital Ads
After stricter consent rules took effect in 2024, one social platform reported a 17% decline in European CPMs during Q1 2025 digital-strategy.ec.europa.eu. Brands reacted by shifting spend toward contextual placements on premium publishers with strong first-party data, partially offsetting the shortfall. Programmatic demand for news outlets rose, suggesting regulations may rebalance power toward content owners. Smaller ad-tech vendors struggle with the cost of parallel consent workflows and seek acquisition by larger peers. Reduced ad yields temper revenue growth in the Media and Entertainment market until ecosystem participants refine compliant targeting methods.
Other drivers and restraints analyzed in the detailed report include:
- Rapid Uptake of FAST Channels in Europe
- Generative-AI Dubbing Accelerates OTT Reach in Multilingual Regions
- Piracy and Illegal Restreaming Curtail OTT ARPUs in Asia-Pacific
For complete list of drivers and restraints, kindly check the Table Of Contents.
Segment Analysis
Digital formats commanded 45% Media and Entertainment market share in 2024, representing USD 1.33 trillion of the Media and Entertainment market size . Streaming platforms mix binge-worthy series with event programming, so subscriber acquisition spikes no longer collapse after season finales. Short-form video added tip-jar features in late 2024, creating micro-transaction income that cushions plateauing ad yields. Print persists in B2B niches where advertisers prize precise readership, and specialist journals limited revenue decline to single digits, underscoring the durability of expert content.
Cross-platform ecosystems prolong franchise life cycles. When a fantasy series spawns a mobile game in the same quarter, 15% of new players subsequently watch at least one episode, illustrating how content can cross-pollinate across experiences. Virtual and augmented reality revenues are smaller in absolute terms but grow quickly thanks to enterprise pilots; an architectural firm used headsets for remote design reviews and cut project cycles by 12% in 2025. Stable enterprise demand steadies headset manufacturers' cash flow, allowing them to subsidise consumer lounges that seed future household uptake. As these dynamics converge, the Media and Entertainment market embeds digital formats even deeper across both consumer and professional use cases.
Media and Entertainment Market is Segments by Type (Print Media [Newspaper, Magazines, and More], Digital Media [Television, Music and Radion, and More], Streaming Media [OTT Streaming, Live Streaming], and More), Revenue Model (Advertising, Subscription, and More), Device Platform (Smartphones and Tablets, Smart TVs and Set-Top Boxes, and More), Geography. The Market Forecasts are Provided in Terms of Value (USD).
Geography Analysis
North America accounted for 35% of the Media and Entertainment market share at USD 1.03 trillion in 2024. Live sports combined with interactive betting overlays increase effective ad inventory by extending session length. Telecom-streamer bundles distribute soaring content costs over larger customer bases, lowering average acquisition costs. Regional cable operators replicated the model in mid-2025, bringing pause-screen shopping widgets to traditional households and enriching data feedback loops that underpin dynamic pricing.
Asia-Pacific leads growth with a 6% forecast CAGR to 2030, propelled by a vibrant short-video ecosystem in China and surging vernacular originals in India. Average monthly mobile data usage in India exceeded 27 GB per user in 2024, underpinning high completion rates for regional titles. Production startups budget at least two language tracks from day one, compressing time-to-market for dubbed versions. Japan and South Korea incubate 5 G-native content formats that subsequently export across Southeast Asia, further widening the Media and Entertainment market footprint.
Europe balances a rich creative heritage with stringent privacy rules. FAST channels give broadcasters new revenue as linear ratings soften, while contextual ad tech helps offset lower personalised targeting yields. Latin America wrestles with currency volatility that squeezes ARPU, yet streaming hours continue to climb, hinting at latent upside when macro conditions stabilise. MENA platforms scaled catalogues rapidly through AI dubbing, and one service lifted its Arabic library by over 70% in 2024. As infrastructure and localisation costs decline, additional audiences come online, reinforcing the global expansion of the Media and Entertainment market.
- News Corporation
- Comcast Corporation
- Walt Disney Company
- Warner Bros. Discovery, Inc.
- Paramount Global
- Netflix, Inc.
- Amazon.com, Inc. (Prime Video)
- Alphabet Inc. (YouTube)
- Apple Inc.
- Sony Group Corporation
- Tencent Holdings Ltd.
- Bertelsmann SE and Co. KGaA
- ByteDance
- Axel Springer SE
- Reliance Industries
- Roku, Inc.
- WPP plc
- Omnicom Group Inc.
- Publicis Groupe
- Spotify Technology S.A.
- Electronic Arts Inc.
- Nintendo Co. Ltd.
- Activision Blizzard, Inc.
Additional Benefits:
- The market estimate (ME) sheet in Excel format
- 3 months of analyst support
TABLE OF CONTENTS
1 INTRODUCTION
- 1.1 Study Assumptions and Market Definition
- 1.2 Scope of the Study
2 RESEARCH METHODOLOGY
3 EXECUTIVE SUMMARY
4 MARKET LANDSCAPE
- 4.1 Market Overview
- 4.2 Market Drivers
- 4.2.1 Proliferation of 5G-enabled Mobile Video Consumption in Asia
- 4.2.2 Surging Connected-TV Ad Spend by U.S. Retail and CPG Brands
- 4.2.3 Rapid Uptake of FAST (Free Ad-Supported TV) Channels in Europe
- 4.2.4 Generative-AI Based Local-Language Dubbing Expanding OTT Reach in MENA
- 4.3 Market Restraints
- 4.3.1 Heightened EU Regulatory Scrutiny on Targeted Digital Ads
- 4.3.2 Piracy and Illegal Restreaming Curtailing Premium OTT ARPUs in APAC
- 4.4 Regulatory Outlook
- 4.5 Porter's Five Forces Analysis
- 4.5.1 Bargaining Power of Suppliers
- 4.5.2 Bargaining Power of Buyers/Consumers
- 4.5.3 Threat of New Entrants
- 4.5.4 Threat of Substitutes
- 4.5.5 Intensity of Competitive Rivalry
- 4.6 Investment and Funding Trends
5 MARKET SIZE AND GROWTH FORECASTS (VALUE)
- 5.1 By Type
- 5.1.1 Print Media
- 5.1.1.1 Newspaper
- 5.1.1.2 Magazines
- 5.1.1.3 Billboards
- 5.1.1.4 Banners, Leaflets and Flyers
- 5.1.1.5 Other Print Media
- 5.1.2 Digital Media
- 5.1.2.1 Television
- 5.1.2.2 Music and Radio
- 5.1.2.3 Electronic Signage
- 5.1.2.4 Mobile Advertising
- 5.1.2.5 Podcasts
- 5.1.2.6 Other Digital Media
- 5.1.3 Streaming Media
- 5.1.3.1 OTT Streaming
- 5.1.3.2 Live Streaming
- 5.1.4 Video Games and eSports
- 5.1.5 Virtual / Augmented Reality Content
- 5.1.1 Print Media
- 5.2 By Revenue Model
- 5.2.1 Advertising
- 5.2.2 Subscription
- 5.2.3 Pay-Per-View / Transactional
- 5.2.4 Licensing and Merchandising
- 5.3 By Device Platform
- 5.3.1 Smartphones and Tablets
- 5.3.2 Smart TVs and Set-top Boxes
- 5.3.3 PCs and Laptops
- 5.3.4 Gaming Consoles
- 5.3.5 VR/AR Headsets
- 5.4 By Geography
- 5.4.1 North America
- 5.4.1.1 United States
- 5.4.1.2 Canada
- 5.4.2 Latin America
- 5.4.2.1 Brazil
- 5.4.2.2 Argentina
- 5.4.2.3 Mexico
- 5.4.2.4 Rest of Latin America
- 5.4.3 Europe
- 5.4.3.1 Germany
- 5.4.3.2 United Kingdom
- 5.4.3.3 France
- 5.4.3.4 Italy
- 5.4.3.5 Spain
- 5.4.3.6 Rest of Europe
- 5.4.4 Asia-Pacific
- 5.4.4.1 China
- 5.4.4.2 Japan
- 5.4.4.3 South Korea
- 5.4.4.4 India
- 5.4.4.5 Australia
- 5.4.4.6 New Zealand
- 5.4.4.7 Rest of Asia-Pacific
- 5.4.5 Middle East and Africa
- 5.4.5.1 United Arab Emirates
- 5.4.5.2 Saudi Arabia
- 5.4.5.3 South Africa
- 5.4.5.4 Rest of Middle East and Africa
- 5.4.1 North America
6 COMPETITIVE LANDSCAPE
- 6.1 Strategic Developments
- 6.2 Vendor Positioning Analysis
- 6.3 Company Profiles (includes Global level Overview, Market level overview, Core Segments, Financials as available, Strategic Information, Products and Services, and Recent Developments)
- 6.3.1 News Corporation
- 6.3.2 Comcast Corporation
- 6.3.3 Walt Disney Company
- 6.3.4 Warner Bros. Discovery, Inc.
- 6.3.5 Paramount Global
- 6.3.6 Netflix, Inc.
- 6.3.7 Amazon.com, Inc. (Prime Video)
- 6.3.8 Alphabet Inc. (YouTube)
- 6.3.9 Apple Inc.
- 6.3.10 Sony Group Corporation
- 6.3.11 Tencent Holdings Ltd.
- 6.3.12 Bertelsmann SE and Co. KGaA
- 6.3.13 ByteDance
- 6.3.14 Axel Springer SE
- 6.3.15 Reliance Industries
- 6.3.16 Roku, Inc.
- 6.3.17 WPP plc
- 6.3.18 Omnicom Group Inc.
- 6.3.19 Publicis Groupe
- 6.3.20 Spotify Technology S.A.
- 6.3.21 Electronic Arts Inc.
- 6.3.22 Nintendo Co. Ltd.
- 6.3.23 Activision Blizzard, Inc.
7 MARKET OPPORTUNITIES AND FUTURE OUTLOOK
- 7.1 White-space and Unmet-Need Assessment

