
PUBLISHER: Mordor Intelligence | PRODUCT CODE: 1851221

PUBLISHER: Mordor Intelligence | PRODUCT CODE: 1851221
United Kingdom Renewable Energy - Market Share Analysis, Industry Trends & Statistics, Growth Forecasts (2025 - 2030)
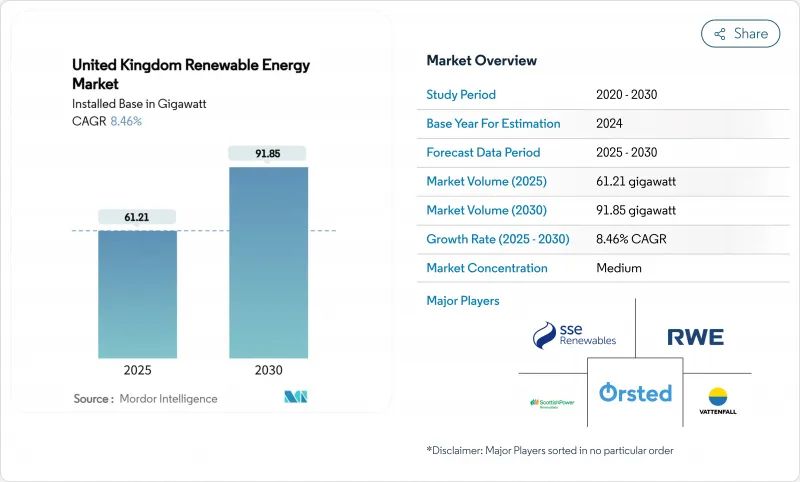
The United Kingdom Renewable Energy Market size in terms of installed base is expected to grow from 61.21 gigawatt in 2025 to 91.85 gigawatt by 2030, at a CAGR of 8.46% during the forecast period (2025-2030).
Rapid deployment aligns with the Clean Power 2030 Action Plan that targets 95% clean electricity generation, reinforcing energy-security ambitions while cutting fossil-fuel imports . Renewables supplied 46.4% of national electricity in 2024, overtaking gas for the first time and underscoring structural demand for low-carbon power. Drivers include offshore wind leadership, falling solar PV capex, and long-dated revenue certainty from the Contracts-for-Difference (CfD) scheme. Investment appetite remains strong as policy clarity, corporate power-purchase agreements, and grid-upgrade commitments improve project bankability.
United Kingdom Renewable Energy Market Trends and Insights
Offshore-wind CfD strike-price resets accelerating the North Sea pipeline
After the previous zero-bid outcome, the government raised strike prices in Allocation Round 6, restoring commercial viability and contracting 5.3 GW of new capacity, including Hornsea 3 and 4. Predictable annual auctions of 6-8 GW underpin supply-chain scaling and have lifted the North Sea development pipeline above 37 GW, supporting the 50 GW by 2030 target .
Contracts-for-Difference scheme providing revenue certainty
Since its inception, the two-way CfD mechanism now backs over 40% of national renewable generation and has mobilized over GBP 100 billion of private capital. Expanding eligibility to tidal streams and floating wind broadens technology coverage and continues to lower the weighted cost of capital for large projects.
National Grid queue bottlenecks causing five-year connection delays
The connection queue has ballooned to 739 GW, with some projects assigned 2035 dates. Ofgem's TMO4+ "first ready, first connected" reforms and the GBP 31 billion Great Grid Upgrade aim to free 500 GW of capacity, yet material relief will appear only after near-term reinforcements such as the GBP 4.3 billion Eastern Green Link 2 cable.
Other drivers and restraints analyzed in the detailed report include:
- Rise of corporate PPAs from UK data-centre and industrial off-takers
- Ofgem RIIO-ED2 grid-upgrade commitments boosting distributed solar
- Reduced Smart-Export-Guarantee tariff hitting rooftop solar ROI
For complete list of drivers and restraints, kindly check the Table Of Contents.
Segment Analysis
Wind contributed 53% of 2024 generation, anchored by high-capacity-factor offshore sites such as the 3.6 GW Dogger Bank complex, while solar posts the fastest 2025-2030 CAGR at 11.2% . Advanced 15 MW turbines and fixed-plus-floating foundations extend wind's edge, but streamlined planning and mandated rooftop deployment from 2025 propel solar's catch-up. Hydro and bioenergy remain steady contributors; the latter awaits commercial bioenergy with carbon capture and storage after 2030. Innovation funding for tidal stream and wave technologies positions the UK renewable energy market for diversified long-term growth.
The solar surge and cost-effective rooftop systems encourage residential and corporate uptake, while tidal stream demonstrators and floating wind prototypes open new resource areas. These shifts ensure the UK renewable energy market continues to rebalance source contributions beyond the current wind-led profile.
The United Kingdom Renewable Energy Market Report is Segmented by Source (Wind, Solar, Hydro, Bioenergy, and Other), Installation Scale (Above 10 MW, 100 KW To 10 MW, and Below 100 KW), and End-User Sector (Utilities, Commercial and Industrial, and Residential). The Market Sizes and Forecasts are Provided in Terms of Installed Capacity (GW).
List of Companies Covered in this Report:
- SSE Renewables
- Orsted A/S
- ScottishPower Renewables (Iberdrola SA)
- RWE Renewables GmbH
- Vattenfall AB
- EDF Energy
- Statkraft AS
- RES Group Ltd.
- Brookfield Renewable Partners
- Greencoat UK Wind PLC
- Bluefield Solar Income Fund
- Octopus Renewables Infrastructure Trust
- NextEnergy Solar Fund
- Equinor ASA
- TotalEnergies SE
- Siemens Gamesa Renewable Energy SA
- Vestas Wind Systems A/S
- GE Vernova
- Lightsource BP
- Drax Group PLC
Additional Benefits:
- The market estimate (ME) sheet in Excel format
- 3 months of analyst support
TABLE OF CONTENTS
1 Introduction
- 1.1 Study Assumptions & Market Definition
- 1.2 Scope of the Study
2 Research Methodology
3 Executive Summary
4 Market Landscape
- 4.1 Market Overview
- 4.2 Market Drivers
- 4.2.1 Offshore-wind CfD Strike-Price Declines Accelerating North-Sea Pipeline
- 4.2.2 Contracts-for-Difference (CfD) Scheme Providing Revenue Certainty
- 4.2.3 Rise of Corporate PPAs from UK Data-Centre & Heavy-Industry Off-takers
- 4.2.4 Ofgem RIIO-ED2 Grid-Upgrade Commitments Boosting Distributed Solar
- 4.2.5 Green-Hydrogen Strategy Linking Electrolyser Build-out to Renewables
- 4.2.6 Cost Drop in Floating Offshore Turbines for Deep-water Scottish Sites
- 4.3 Market Restraints
- 4.3.1 National-Grid Queue Bottlenecks Causing 5-year Connection Delays
- 4.3.2 Reduced Smart-Export-Guarantee Tariff Hitting Rooftop Solar ROI
- 4.3.3 Offshore-Wind Monopile Cost Inflation Post-Brexit Steel Tariffs
- 4.3.4 Visual-Impact Objections Stalling Onshore Wind Permitting
- 4.4 Supply-Chain Analysis
- 4.5 Regulatory Outlook
- 4.6 Technological Outlook
- 4.7 Porter's Five Forces
- 4.7.1 Threat of New Entrants
- 4.7.2 Bargaining Power of Suppliers
- 4.7.3 Bargaining Power of Buyers
- 4.7.4 Threat of Substitutes
- 4.7.5 Industry Rivalry
- 4.8 PESTLE Analysis
5 Market Size & Growth Forecasts
- 5.1 By Source
- 5.1.1 Wind (Onshore Wind, Offshore Wind, and Floating Offshore Wind)
- 5.1.2 Solar (Utility-scale PV, Commercial and Industrial Rooftop PV, and Residential Rooftop PV)
- 5.1.3 Hydro (Small, Large, Pumped Storage)
- 5.1.4 Bioenergy (Biomass, Biogas)
- 5.1.5 Other (Geothermal, Tidal-Stream, Wave)
- 5.2 By Installation Scale
- 5.2.1 Above 10 MW
- 5.2.2 100 kW to 10 MW
- 5.2.3 Below 100 kW
- 5.3 By End-User Sector
- 5.3.1 Utilities
- 5.3.2 Commercial and Industrial
- 5.3.3 Residential
6 Competitive Landscape
- 6.1 Market Concentration
- 6.2 Strategic Moves (M&A, Partnerships, PPAs)
- 6.3 Market Share Analysis (Market Rank/Share for key companies)
- 6.4 Company Profiles (includes Global level Overview, Market level overview, Core Segments, Financials as available, Strategic Information, Products & Services, and Recent Developments)
- 6.4.1 SSE Renewables
- 6.4.2 Orsted A/S
- 6.4.3 ScottishPower Renewables (Iberdrola SA)
- 6.4.4 RWE Renewables GmbH
- 6.4.5 Vattenfall AB
- 6.4.6 EDF Energy
- 6.4.7 Statkraft AS
- 6.4.8 RES Group Ltd.
- 6.4.9 Brookfield Renewable Partners
- 6.4.10 Greencoat UK Wind PLC
- 6.4.11 Bluefield Solar Income Fund
- 6.4.12 Octopus Renewables Infrastructure Trust
- 6.4.13 NextEnergy Solar Fund
- 6.4.14 Equinor ASA
- 6.4.15 TotalEnergies SE
- 6.4.16 Siemens Gamesa Renewable Energy SA
- 6.4.17 Vestas Wind Systems A/S
- 6.4.18 GE Vernova
- 6.4.19 Lightsource BP
- 6.4.20 Drax Group PLC
7 Market Opportunities & Future Outlook
- 7.1 White-space & Unmet-Need Assessment
- 7.2 10 GW Floating-Wind Pipeline Beyond 2030 Target

