
PUBLISHER: Mordor Intelligence | PRODUCT CODE: 1851282

PUBLISHER: Mordor Intelligence | PRODUCT CODE: 1851282
Distributed Power Generation - Market Share Analysis, Industry Trends & Statistics, Growth Forecasts (2025 - 2030)
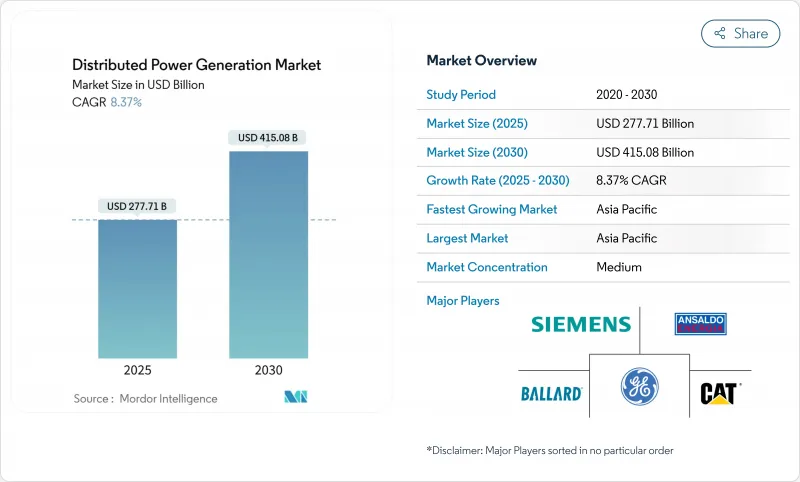
The Distributed Power Generation Market size is estimated at USD 277.71 billion in 2025, and is expected to reach USD 415.08 billion by 2030, at a CAGR of 8.37% during the forecast period (2025-2030).
The expansion reflects a structural move from centralized supply toward local assets that combine solar, fuel-flexible engines, and digital controls. Widespread equipment cost reductions, pro-renewable regulations, and rising grid-resilience needs are the main accelerants. Asia-Pacific anchors volume and momentum, while North America leverages abundant gas, and Europe focuses on energy security. Technology competition revolves around hydrogen-ready fuel cells and integrated microgrid offerings that bundle storage, software, and services. At the same time, interconnection bottlenecks, energy-storage capital needs, and tightening emission caps shape investment risk.
Global Distributed Power Generation Market Trends and Insights
Rapid Decline in Small-Scale Solar-PV LCOE
Chinese TOPCon module prices fell to USD 0.16 per watt in 2024, driving a region-wide drop in levelized electricity costs and reshaping distributed economics. Installation labor standardization, low-cost inverters, and concessional finance amplify the effect, positioning Asia-Pacific as the global benchmark for small-scale PV. Governments streamline permitting and grid-code rules, further shortening project cycles. The price pressure forces suppliers elsewhere to differentiate on efficiency and application-specific design.
Booming Commercial & Industrial Behind-the-Meter Installations
European firms accelerate on-site generation to hedge volatile wholesale prices and meet corporate decarbonization pledges. Record rooftop additions in Germany follow EU rules that require solar on new commercial buildings from 2026, broadening to retrofits by 2028. Battery systems paired with PV allow load shifting and ancillary service income, making distributed assets a financial and environmental tool. North American businesses replicate the model, spurred by federal tax incentives and state clean-energy mandates.
Distribution-Network Interconnection Barriers in Emerging Economies
Renewables waiting in global interconnection queues exceed 3,000 GW, and 80% of applications are withdrawn due to escalating costs or long studies. Emerging grids lack modern standards and workforce capacity, so small projects face disproportionate delays. Although a "first-ready, first-served" reform is underway, progress outside advanced markets remains slow, restraining near-term deployment.
Other drivers and restraints analyzed in the detailed report include:
- Microgrid Adoption for Telecom Towers across Africa & Islands
- Natural-Gas Price Volatility Shifting Demand toward Biogas Gensets
- Capital-Intensive Energy-Storage Pairing for Intermittent DG
For complete list of drivers and restraints, kindly check the Table Of Contents.
Segment Analysis
The solar segment commanded 35% of 2024 revenues, anchored by residential and light-commercial rooftops that capitalize on simplified mounting and inverter kits. Solar's share of the distributed power generation market size for 2024 stood at USD 88.9 billion. Though smaller today, fuel cells deliver the highest 11.8% CAGR, led by projects at data-center campuses where operators seek diesel-free uptime. Caterpillar validated a 1.5 MW hydrogen fuel-cell backup system that met a 99.999% service-level target for a hyperscale facility in Wyoming. Wind micro-turbines and reciprocating gas engines round out the mix, serving niche sites that value either land-use efficiency or combined heat-and-power capability. Competitive dynamics now center on integrating storage and power electronics rather than standalone generation hardware.
Household and small-business systems in the 0-100 kW bracket captured 47% of 2024 demand, reflecting kit-based procurement and turnkey installation models. The segment accounted for the largest distributed power generation market share in unit terms. At the other extreme, Above 1,000 kW solutions will record a 10.2% CAGR through 2030 as industrial campuses opt for on-site generation to bypass grid constraints. Vendors differentiate through digital twins and O&M analytics that fine-tune dispatch against utility tariffs. Mid-range 101-1,000 kW packages serve hospitals and university estates, balancing standardized skids with limited custom engineering.
The Distributed Power Generation Market Report is Segmented by Technology (Solar, Wind Turbines, Gas Turbines, Diesel Gensets, Fuel Cells, and More), by Rating (0 To 100 KW, 101 To 1, 000 KW, and More), Fuel Type (Renewable and Non-Renewable), Connectivity (On-Grid and Off-Grid), End-User (Residential, Telecom and Data Centers, and More), and Geography (North America, Europe, Asia-Pacific, South America, and Middle East and Africa).
Geography Analysis
Asia-Pacific dominated the distributed power generation market with a 44% revenue share in 2024 and continues to post the fastest 11.1% CAGR to 2030. Regional leadership rests on mass-manufactured PV modules, extensive policy incentives, and surging electricity demand. China's rooftop program alone realized more than 50 GW of new capacity in 2024, while India's distribution utilities aggregate rooftop installations into virtual power plants. Several Southeast Asian governments are formalizing net-billing regimes, unlocking behind-the-meter investment.
North America ranks second in absolute value and combines an abundant natural gas supply with favorable tax credits. American Municipal Power's 20 MW behind-the-meter program in Michigan typifies how municipal utilities leverage local generation for peak shaving. Thirty state-level renewable portfolio standards catalyze solar-plus-storage at schools and municipal facilities. Data-center clusters in Virginia, Texas, and Alberta drive early adoption of dual-fuel or hydrogen-ready engines, further lifting the region's demand profile.
Europe's distributed strategy aligns with energy-security imperatives following geopolitical gas disruptions. The EU Solar Standard obliges new commercial buildings to integrate PV from 2026, pushing developers toward distributed layouts. France mandates 50% solar coverage on parking lots over 1 500 m2, with fines up to EUR 40 000 for non-compliance, accelerating commercial-real-estate retrofits. Germany simplified the registration of "balcony power plants" up to 800 W, broadening household participation. Heritage-site constraints and lengthy city-level permitting temper growth in historic urban cores.
- Caterpillar Inc.
- Cummins Inc.
- Siemens AG
- General Electric Co.
- Schneider Electric SE
- Ansaldo Energia SpA
- Ballard Power Systems Inc.
- Bloom Energy Corp.
- Capstone Turbine Corp.
- FuelCell Energy Inc.
- Rolls-Royce plc (mtu Onsite Energy)
- Aggreko Ltd.
- Yanmar Holdings Co., Ltd.
- Wartsila Corp.
- Kohler Co.
- Canadian Solar Inc.
- Sunverge Energy Inc.
- MTU Aero Engines AG Microgrid Solutions
- Generac Power Systems Inc.
- Plug Power Inc.
Additional Benefits:
- The market estimate (ME) sheet in Excel format
- 3 months of analyst support
TABLE OF CONTENTS
1 Introduction
- 1.1 Study Assumptions & Market Definition
- 1.2 Scope of the Study
2 Research Methodology
3 Executive Summary
4 Market Landscape
- 4.1 Market Overview
- 4.2 Market Drivers
- 4.2.1 Rapid Decline in Small-Scale Solar-PV LCOE in Asia
- 4.2.2 Booming Commercial & Industrial (C&I) Behind-the-Meter Installations in Europe
- 4.2.3 Microgrid Adoption for Telecom Towers across Africa & Islands
- 4.2.4 Natural-Gas Price Volatility Shifting Demand toward Biogas Gensets in North America
- 4.2.5 Mandated Renewable Portfolio Standards (RPS) in U.S. Municipal Utilities
- 4.2.6 Hydrogen-Ready Fuel-Cell Pilots in Middle-East Data Centers
- 4.3 Market Restraints
- 4.3.1 Distribution-Network Interconnection Barriers in Emerging Economies
- 4.3.2 Capital-Intensive Energy-Storage Pairing for Intermittent DG
- 4.3.3 Stringent NOx/PM Limits Curtailing Diesel Genset Sales in EU Urban Areas
- 4.3.4 Complex Permitting for Rooftop PV in Historic City Centers
- 4.4 Supply-Chain Analysis
- 4.5 Regulatory Outlook
- 4.6 Technological Outlook
- 4.7 Porters Five Forces
- 4.7.1 Bargaining Power of Suppliers
- 4.7.2 Bargaining Power of Consumers
- 4.7.3 Threat of New Entrants
- 4.7.4 Threat of Substitute Products & Services
- 4.7.5 Intensity of Competitive Rivalry
5 Market Size & Growth Forecasts
- 5.1 By Technology
- 5.1.1 Solar Photovoltaic (Rooftop & Ground-Mounted <=5 MW)
- 5.1.2 Wind Turbines (<=5 MW)
- 5.1.3 Microturbines
- 5.1.4 Gas Turbines (<=50 MW)
- 5.1.5 Fuel Cells (PEMFC, SOFC, Others)
- 5.1.6 Diesel Gensets
- 5.1.7 Natural-Gas Gensets
- 5.1.8 Hydrokinetic and Small Hydro (<=10 MW)
- 5.1.9 Others (Biomass CHP, Stirling Engines)
- 5.2 By Power Rating
- 5.2.1 0 to 100 kW
- 5.2.2 101 to 1,000 kW
- 5.2.3 Above 1,000 kW
- 5.3 By Fuel Type
- 5.3.1 Renewable
- 5.3.2 Non-Renewable
- 5.4 By Connectivity
- 5.4.1 On-Grid
- 5.4.2 Off-Grid and Remote
- 5.5 By End-user
- 5.5.1 Residential
- 5.5.2 Commercial and Institutional
- 5.5.3 Industrial and Manufacturing
- 5.5.4 Utility and IPP Peaking/Reserve
- 5.5.5 Telecom and Data Centers
- 5.6 By Geography
- 5.6.1 North America
- 5.6.1.1 United States
- 5.6.1.2 Canada
- 5.6.1.3 Mexico
- 5.6.2 Europe
- 5.6.2.1 United Kingdom
- 5.6.2.2 Germany
- 5.6.2.3 France
- 5.6.2.4 Spain
- 5.6.2.5 Nordic Countries
- 5.6.2.6 Russia
- 5.6.2.7 Rest of Europe
- 5.6.3 Asia-Pacific
- 5.6.3.1 China
- 5.6.3.2 India
- 5.6.3.3 Japan
- 5.6.3.4 South Korea
- 5.6.3.5 Malaysia
- 5.6.3.6 Thailand
- 5.6.3.7 Indonesia
- 5.6.3.8 Vietnam
- 5.6.3.9 Australia
- 5.6.3.10 Rest of Asia-Pacific
- 5.6.4 South America
- 5.6.4.1 Brazil
- 5.6.4.2 Argentina
- 5.6.4.3 Colombia
- 5.6.4.4 Rest of South America
- 5.6.5 Middle East and Africa
- 5.6.5.1 United Arab Emirates
- 5.6.5.2 Saudi Arabia
- 5.6.5.3 South Africa
- 5.6.5.4 Egypt
- 5.6.5.5 Rest of Middle East and Africa
- 5.6.1 North America
6 Competitive Landscape
- 6.1 Market Concentration
- 6.2 Strategic Moves (M&A, Partnerships, PPAs)
- 6.3 Market Share Analysis (Market Rank/Share for key companies)
- 6.4 Company Profiles (includes Global level Overview, Market level overview, Core Segments, Financials as available, Strategic Information, Products & Services, and Recent Developments)
- 6.4.1 Caterpillar Inc.
- 6.4.2 Cummins Inc.
- 6.4.3 Siemens AG
- 6.4.4 General Electric Co.
- 6.4.5 Schneider Electric SE
- 6.4.6 Ansaldo Energia SpA
- 6.4.7 Ballard Power Systems Inc.
- 6.4.8 Bloom Energy Corp.
- 6.4.9 Capstone Turbine Corp.
- 6.4.10 FuelCell Energy Inc.
- 6.4.11 Rolls-Royce plc (mtu Onsite Energy)
- 6.4.12 Aggreko Ltd.
- 6.4.13 Yanmar Holdings Co., Ltd.
- 6.4.14 Wartsila Corp.
- 6.4.15 Kohler Co.
- 6.4.16 Canadian Solar Inc.
- 6.4.17 Sunverge Energy Inc.
- 6.4.18 MTU Aero Engines AG Microgrid Solutions
- 6.4.19 Generac Power Systems Inc.
- 6.4.20 Plug Power Inc.
7 Market Opportunities & Future Outlook
- 7.1 White-space & Unmet-Need Assessment

