
PUBLISHER: Mordor Intelligence | PRODUCT CODE: 1851294

PUBLISHER: Mordor Intelligence | PRODUCT CODE: 1851294
Global Bioactive Ingredients - Market Share Analysis, Industry Trends & Statistics, Growth Forecasts (2025 - 2030)
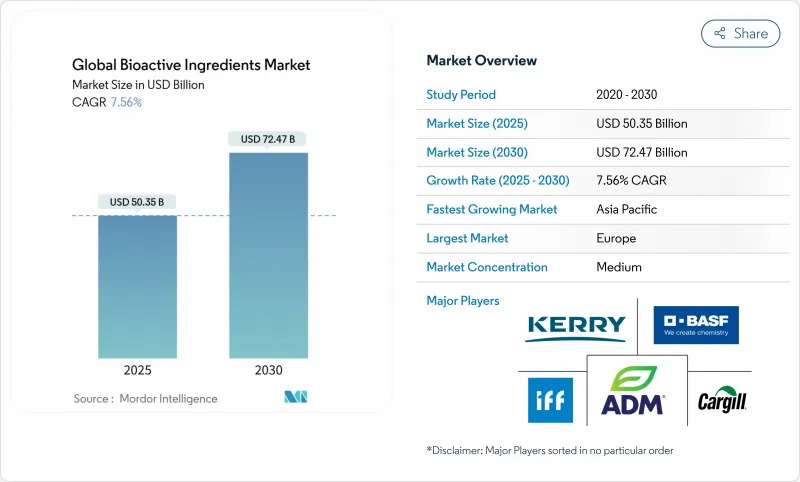
The global bioactive ingredients market is estimated to reach USD 50.35 billion in 2025 and is projected to expand to USD 72.47 billion by 2030, growing at a CAGR 7.56% during the forecast period (2025-2030).
This growth corresponds with increasing consumer demand for functional foods and supplements that support disease prevention and wellness. Several factors drive market development, including enhanced food safety regulations and ingredient approval processes that improve product quality and market access. Technological progress in ingredient delivery systems has enhanced bioavailability and efficacy. Consumer awareness of preventive healthcare and self-care practices has led to higher consumption of functional foods and supplements. The expanding aging population and their nutritional requirements have increased demand for targeted bioactive solutions. Furthermore, advances in nutrigenomics and personalized nutrition research have created new opportunities for specialized bioactive ingredients.
Global Bioactive Ingredients Market Trends and Insights
Rising consumer demand for health and wellness products
The increasing consumer emphasis on preventive healthcare drives the adoption of bioactive ingredients in functional foods, dietary supplements, and personalized nutrition products. Health consciousness and understanding of nutrition's role in disease prevention serve as primary market drivers, while the global aging population seeks natural health solutions. Consumer preference for clean-label products and sustainable sourcing has increased demand for plant-based ingredients. Increased disposable income in developing economies has expanded consumer access to premium nutritional products, exemplified by Nestle's NAN Sinergity infant formula with six human milk oligosaccharides and Bifidobacterium infantis. Improved ingredient extraction and processing technologies have enhanced the efficiency and quality of bioactive ingredients, while major companies' increased research and development investments strengthen scientific validation. The growth of distribution channels, especially e-commerce, has improved product accessibility and market reach, supporting industry expansion.
Growing prevalence of chronic and age-related conditions
The increasing aging population and prevalence of chronic diseases drive the demand for bioactive ingredients that offer therapeutic benefits, particularly for cardiovascular health, cognitive function, and metabolic disorders. Nestle Health Science's COGNIKET-MCI trial, which studies BrainXpert ketogenic products for mild cognitive impairment, demonstrates the pharmaceutical applications of these ingredients. The condition affects approximately 20% of individuals over 65 years . The trial encompasses 380 participants across seven countries and evaluates cognitive decline prevention, quality of life improvement, and sleep quality enhancement through medium chain triglycerides and B-vitamins. Plant-derived bioactive compounds demonstrate effectiveness in neuroprotective, metabolic, and hepatoprotective applications. Compounds such as ellagic acid and gallic acid provide antioxidant and anti-inflammatory benefits essential for addressing non-communicable diseases. The market impact is significant, as AI-driven precision nutrition interventions reduce healthcare costs through improved health outcomes, contributing to market sustainability as healthcare systems emphasize prevention over treatment.
Price volatility and sustainability challenges in raw material sourcing
The concentration of supply chains creates vulnerabilities in the vitamin market, demonstrating risks in raw material sourcing for bioactive ingredients. Market disruptions in 2024 included a European producer explosion affecting Vitamin E and A supplies, highlighting the risks of concentrated production facilities. Vitamin D3 prices remained high due to supply limitations, while Vitamin C prices decreased due to excess capacity . New tariffs, including 25% on Canadian and Mexican goods and 10% on Chinese imports, created additional cost pressures . These tariffs significantly impacted herbal ingredients where alternative sourcing was limited. The increased costs affected manufacturers' profit margins and pricing ability. Supply chain vulnerabilities and trade barriers present challenges for market participants, potentially restricting market expansion and new product development. The geographical concentration of raw materials creates risks for supply and quality control. Environmental, political, or economic challenges in primary production regions cause disruptions across the supply chain. These factors limit market growth and require more resilient supply chain strategies.
Other drivers and restraints analyzed in the detailed report include:
- Surging demand for plant-based and sustainable ingredients
- Expanding pharmaceutical applications
- Complex and stringent regulatory framework
For complete list of drivers and restraints, kindly check the Table Of Contents.
Segment Analysis
Vitamins hold the largest market share at 23.25% in 2024, due to their established consumer acceptance and broad use in dietary supplements and food fortification. The vitamin segment's dominance stems from increased consumer focus on preventive healthcare, growing fortification mandates across countries, and rising demand in developing markets. The omega-3 fatty acids segment faces supply chain difficulties, as increased contamination cases require stricter testing procedures and quality assurance measures. These challenges primarily affect fish oil-based omega-3 sources, leading manufacturers to explore alternative sources like algae and krill oil while implementing advanced purification technologies.
The probiotics segment is projected to grow at a CAGR of 9.15% through 2030, driven by expanding knowledge of gut health and microbiome research developments. The growth trajectory is particularly evident in functional foods, where manufacturers are incorporating diverse probiotic strains to meet consumer demand. In the beverage sector, probiotic-enriched drinks continue to gain market share, especially in dairy-based and plant-based alternatives. The dietary supplements category shows robust growth, with consumers increasingly seeking specialized probiotic formulations for specific health benefits. The prebiotics segment demonstrates steady growth, primarily through ingredients like inulin and fructooligosaccharides that complement probiotic products.
Plant-based sources hold a 63.15% market share in 2024, driven by consumer demand for sustainable options and regulatory approval of botanical ingredients. These sources benefit from well-established supply chains, extensive scientific validation, and cost-effective production methods. Recent agricultural innovations and enhanced extraction processes have improved both yield and quality of botanical ingredients, strengthening their market position. The widespread acceptance of plant-based colors is further supported by their proven safety record and compatibility with various food applications. The market dominance is reinforced by continuous research and development efforts focused on improving color stability and expanding the range of natural shades available.
Microbial-based alternatives are growing at a 10.46% CAGR, primarily due to innovations in precision fermentation that enable the production of complex color molecules. This growth is driven by new fermentation facility investments, improved production strains, and advanced bioprocessing methods. The technology enables consistent year-round production while reducing environmental impact and maintaining product quality standards. Microbial sources offer advantages in scalability and resource efficiency compared to traditional extraction methods. The segment's growth is further accelerated by increasing industry adoption and ongoing technological advancements in fermentation processes.
The Bioactive Ingredients Market Report Segments the Industry Into by Product Type (Vitamins, Probiotics, and More), Source (Plant-Based, Microbial-Based, and More), Form (Solid, Liquid, and Other Forms), Application (Dietary Supplements, Food and Beverages, and More), and Geography (North America, Europe, Asia-Pacific, South America, and Middle East and Africa). The Market Forecasts are Provided in Terms of Value (USD).
Geography Analysis
Europe holds 34.59% market share in 2024, driven by robust regulations and high consumer health awareness. The European Food Safety Authority's updated novel food guidance, effective February 2025, improves application processes through standardized documentation and digital platforms. Germany leads consumption through strong retail distribution networks, while the United Kingdom focuses on plant-based innovations. France emphasizes natural ingredient applications, and the Netherlands has emerged as a center for precision fermentation and sustainable ingredient innovation.
Asia-Pacific exhibits the highest growth rate at 10.79% CAGR through 2030, supported by increasing disposable incomes and health awareness. China leads regional consumption despite supply chain challenges, with significant expansion in domestic ingredient manufacturing. India presents substantial growth opportunities with new regulatory approvals and government support for traditional medicine ingredients. Australia maintains high regulatory standards through strict quality control measures, while ASEAN countries develop harmonized guidelines. Indonesia, Thailand, and Vietnam improve testing infrastructure to meet rising health demand.
North America displays established market characteristics with comprehensive regulatory structures and consistent supplement consumption. The FDA's GRAS rule modifications enhance ingredient transparency through mandatory electronic notifications and safety documentation. Manufacturers face new compliance requirements, including additional safety studies and expert panel evaluations. Canada and Mexico experience increased tariff impacts on specialty ingredients and botanical extracts. The United States advances precision nutrition through artificial intelligence applications and extensive clinical research programs.
- Archer-Daniels-Midland Company
- International Flavors & Fragrances Inc.
- Kerry Group plc
- BASF SE
- Cargill, Incorporated
- DSM-Firmenich AG
- Ingredion Incorporated
- Royal FrieslandCampina N.V.
- Chr. Hansen A/S
- Croda International Plc
- Evonik Industries AG
- Glanbia plc
- Symrise AG
- GNC Holdings, LLC
- Sabinsa Corporation
- Stryka Bioactive
- Advanced Enzyme Technologies
- BJP Laboratories
- AB-BIOTICS, SA
- Suedzucker AG
Additional Benefits:
- The market estimate (ME) sheet in Excel format
- 3 months of analyst support
TABLE OF CONTENTS
1 INTRODUCTION
- 1.1 Study Assumptions and Market Definition
- 1.2 Scope of the Study
2 RESEARCH METHODOLOGY
3 EXECUTIVE SUMMARY
4 MARKET LANDSCAPE
- 4.1 Market Overview
- 4.2 Market Drivers
- 4.2.1 Rising Consumer Demand for Health and Wellness Products
- 4.2.2 Growing Prevalence of Chronic and Age-Related Conditions
- 4.2.3 Surging Demand for Plant-Based and Sustainable Ingredients
- 4.2.4 Expanding Pharmaceutical Applications
- 4.2.5 Rising Popularity of Personalized Nutrition
- 4.2.6 Technological Advancements in Ingredient Delivery
- 4.3 Market Restraints
- 4.3.1 Price Volatility and Sustainability Challenges in Raw Material Sourcing
- 4.3.2 Limited bioavailability of certain ingredients
- 4.3.3 Complex and Stringent Regulatory Framework
- 4.3.4 Competition from Cost-Effective Synthetic Alternatives
- 4.4 Supply Chain Analysis
- 4.5 Regulatory Landscape
- 4.6 Technological Outlook
- 4.7 Porter's Five Forces Analysis
- 4.7.1 Threat of New Entrants
- 4.7.2 Bargaining Power of Buyers/Consumers
- 4.7.3 Bargaining Power of Suppliers
- 4.7.4 Threat of Substitute Products
- 4.7.5 Intensity of Competitive Rivalry
5 MARKET SIZE AND GROWTH FORECASTS (VALUE)
- 5.1 By Type
- 5.1.1 Vitamins
- 5.1.2 Probiotics
- 5.1.3 Prebiotics
- 5.1.4 Omega-3 Fatty Acids
- 5.1.5 Carotenoids
- 5.1.6 Plant Extracts
- 5.1.7 Minerals
- 5.1.8 Others
- 5.2 By Source
- 5.2.1 Plant-based
- 5.2.2 Microbial-based
- 5.2.3 Animal-based
- 5.2.4 Others
- 5.3 By Form
- 5.3.1 Solid
- 5.3.2 Liquid
- 5.3.3 Others
- 5.4 By Application
- 5.4.1 Dietary Supplements
- 5.4.2 Food and Beverages
- 5.4.3 Animal Nutrition
- 5.4.4 Others
- 5.5 Geography
- 5.5.1 North America
- 5.5.1.1 United States
- 5.5.1.2 Canada
- 5.5.1.3 Mexico
- 5.5.1.4 Rest of North America
- 5.5.2 Europe
- 5.5.2.1 Germany
- 5.5.2.2 United Kingdom
- 5.5.2.3 Italy
- 5.5.2.4 France
- 5.5.2.5 Spain
- 5.5.2.6 Netherlands
- 5.5.2.7 Rest of Europe
- 5.5.3 Asia-Pacific
- 5.5.3.1 China
- 5.5.3.2 India
- 5.5.3.3 Japan
- 5.5.3.4 Australia
- 5.5.3.5 South Korea
- 5.5.3.6 Rest of Asia-Pacific
- 5.5.4 South America
- 5.5.4.1 Brazil
- 5.5.4.2 Argentina
- 5.5.4.3 Rest of South America
- 5.5.5 Middle East and Africa
- 5.5.5.1 South Africa
- 5.5.5.2 Saudi Arabia
- 5.5.5.3 United Arab Emirates
- 5.5.5.4 Rest of Middle East and Africa
- 5.5.1 North America
6 COMPETITIVE LANDSCAPE
- 6.1 Market Concentration
- 6.2 Strategic Moves
- 6.3 Market Ranking Analysis
- 6.4 Company Profiles (includes Global level Overview, Market level overview, Core Segments, Financials as available, Strategic Information, Market Rank/Share for key companies, Products and Services, and Recent Developments)
- 6.4.1 Archer-Daniels-Midland Company
- 6.4.2 International Flavors & Fragrances Inc.
- 6.4.3 Kerry Group plc
- 6.4.4 BASF SE
- 6.4.5 Cargill, Incorporated
- 6.4.6 DSM-Firmenich AG
- 6.4.7 Ingredion Incorporated
- 6.4.8 Royal FrieslandCampina N.V.
- 6.4.9 Chr. Hansen A/S
- 6.4.10 Croda International Plc
- 6.4.11 Evonik Industries AG
- 6.4.12 Glanbia plc
- 6.4.13 Symrise AG
- 6.4.14 GNC Holdings, LLC
- 6.4.15 Sabinsa Corporation
- 6.4.16 Stryka Bioactive
- 6.4.17 Advanced Enzyme Technologies
- 6.4.18 BJP Laboratories
- 6.4.19 AB-BIOTICS, SA
- 6.4.20 Suedzucker AG
7 MARKET OPPORTUNITIES AND FUTURE OUTLOOK

