
PUBLISHER: Mordor Intelligence | PRODUCT CODE: 1939031

PUBLISHER: Mordor Intelligence | PRODUCT CODE: 1939031
Video-on-Demand - Market Share Analysis, Industry Trends & Statistics, Growth Forecasts (2026 - 2031)
The Video-on-Demand market was valued at USD 126.16 billion in 2025 and estimated to grow from USD 140.63 billion in 2026 to reach USD 241.73 billion by 2031, at a CAGR of 11.47% during the forecast period (2026-2031).
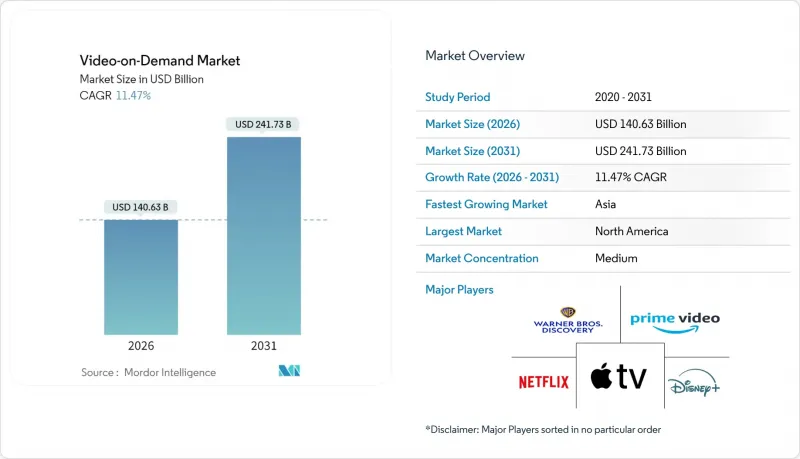
This acceleration mirrors the steady shift from scheduled television to on-demand streaming, supported by rapid broadband rollouts, device proliferation, and richer content libraries. Ultra-high-speed fiber and 5G coverage in North America and Western Europe enable smooth 4K playback, while local-language production budgets in Asia keep regional viewers engaged. The surge of ad-supported tiers offers price-sensitive households alternative entry points, and telecom bundles are lowering acquisition costs in Latin America. The competitive intensity remains high as market leaders hedge churn risk through content exclusivity, cross-service bundles, and cost-efficient delivery networks.
Global Video-on-Demand Market Trends and Insights
Rapid Adoption of AVOD Platforms in Emerging Asia-Pacific Markets
Asia-Pacific audiences are embracing ad-supported offerings as platforms trade lower fees for higher reach, a tactic that garnered a USD 24.4 billion regional video revenue pool in 2023 avia.org. Advertisers value the 1.4 billion unique viewers who collectively streamed almost 14 billion hours of Asian content in the same year avia.org. Forecasts suggest the region will unlock another USD 21 billion in video earnings by 2030 as AVOD inventory scales advanced-television.com . Multilingual ad load personalization and audience-based buying is raising CPMs, allowing platforms to offset thinner subscription margins. Together, these dynamics elevate AVOD from a supplemental to a core monetization pillar across emerging economies.
Expansion of Ultra-High-Speed Broadband Rollout in North America & Western Europe
Fiber-to-the-home penetration, 5G fixed-wireless access, and dynamic CDN routing now underpin seamless UHD delivery. Western European OTT episode and movie revenue will jump to USD 48 billion by 2029 from USD 31 billion in 2023 digitaltvnews.net . Operators are piloting multicast-assisted unicast delivery that can trim bandwidth use by as much as 90% during live traffic peaks streamtvinsider.com . Viewers benefit through faster start times and reduced buffering across TVs, phones, and in-vehicle screens. Such quality upgrades raise engagement minutes, directly supporting ARPU stability within the Video-on-Demand market.
Escalating Content Licensing Costs Squeezing Platform Margins
Multiyear bidding wars over hit franchises inflate minimum guarantees, squeezing service profitability. Some mid-tier providers have culled libraries, positioning themselves either as buyers of exclusive hits or as sellers monetizing deep back catalogs. The European Commission notes that generative AI tools could eventually ease production costs but the near-term imbalance between spending and returns persists ec.europa.eu. Consequently, operators either push prices up or introduce lower-tier plans with ads, reinforcing the two-track monetization model visible throughout the Video-on-Demand market.
Other drivers and restraints analyzed in the detailed report include:
- Increased Content Investments in Local-Language Originals by Global Streamers
- Bundling of VoD with Telecom & Pay-TV Subscriptions Driving Uptake in South America
- Rising Churn Rates Due to Subscription Fatigue in Matured SVOD Markets
For complete list of drivers and restraints, kindly check the Table Of Contents.
Segment Analysis
SVOD controlled 83.92% revenue in 2025, reflecting its early-mover status, but AVOD's 11.01% forecast CAGR signals accelerating demand for low-cost entertainment. The Video-on-Demand market size attributable to AVOD will widen as global advertising outlays migrate to connected screens. Hybrid packages that merge limited ads with modest fees are emerging to curb subscription fatigue while preserving predictable cash receipts. Niche TVOD windows retain relevance for blockbuster premieres, with sports pay-per-view sustaining premium pricing elasticity.
Consumers in emerging economies increasingly treat AVOD as a first-choice service rather than a fallback, prompting platforms to localize ad creative and shorten ad loads. Advertisers, meanwhile, gain addressable targeting that rivals social media precision. For SVOD incumbents, gradual entry into advertising mitigates ARPU erosion. Together, these shifts refine monetization structures without altering the centrality of customer experience within the broader Video-on-Demand market.
OTT streaming garnered 71.35% of 2025 revenues and is forecast at 11.22% CAGR through 2031. Unlike managed IPTV, OTT scales globally via open internet and adaptive bitrate protocols. MAUD trials that cut peak bandwidth needs by up to 90% further bolster cost efficiency for live events streamtvinsider.com. Thus, the Video-on-Demand market size for OTT channels will outpace legacy cable and satellite, even where Pay-TV VoD persists.
IPTV remains entrenched in regions with bundled DSL and fiber offerings, while HbbTV adoption in Europe and Brazil's upcoming TV 3.0 highlight hybrid models that blend broadcast reach with broadband flexibility advanced-television.com. Looking ahead, the Video-on-Demand industry will integrate edge compute nodes to slash latency for immersive experiences such as volumetric video.
The Video-On-Demand (VoD) Market Report is Segmented by Business Model (Subscription VoD, Advertising VoD, and More), Delivery Technology (OTT Streaming, IPTV VoD, and More), Device Type (Smartphones and Tablets, Smart TVs, and More), Content Genre (Entertainment and Drama, Sports, and More), End-User (Residential, Commercial and Enterprise, and More), and Geography. The Market Forecasts are Provided in Terms of Value (USD).
Geography Analysis
North America remained the largest contributor at 41.10% revenue share in 2025, benefiting from early broadband ubiquity and deep original-content pipelines. Industry bundles launched in 2025 combine multiple flagship services into discounted packages, an antidote to subscription fatigue. Federal infrastructure grants continue to extend rural fiber, reinforcing the Video-on-Demand market's leadership position.
Asia-Pacific is the fastest-growing territory, tracking a 12.05% CAGR to 2031. National initiatives spanning 5G, cloud, and local-language production have spurred USD 24.4 billion in 2023 regional revenue avia.org. India and China top subscriber additions, while Japan and South Korea export cultural hits that travel well internationally. Growth is further supported by robust digital advertising spend, underpinning AVOD viability across emerging economies.
Latin America shows accelerating scale, projected to host 165 million SVOD accounts by 2029 advanced-television.com. Brazil alone may surpass 59 million subs. Telco partnerships ease payments and satisfy bandwidth requirements via ongoing fiber projects such as Entel's USD 618 million 2024 investment entel.cl. Although global majors dominate, local platforms still secure 8% market share, reflecting regional storytelling demand within the Video-on-Demand market.
- Amazon.com Inc. (Prime Video)
- Netflix Inc.
- The Walt Disney Company (Disney+ and Hulu)
- Warner Bros. Discovery Inc. (Max)
- Apple Inc. (Apple TV+)
- Alphabet Inc. (YouTube Premium and YouTube TV)
- Comcast Corporation (Peacock and Xfinity On-Demand)
- Paramount Global (Paramount+)
- Roku Inc.
- Tencent Holdings Ltd. (Tencent Video)
- Alibaba Group (Youku Tudou)
- Baidu Inc. (iQIYI)
- Zee Entertainment Enterprises Ltd. (ZEE5)
- Reliance Industries Ltd. (JioCinema)
- Novi Digital Entertainment Pvt. Ltd. (Disney+ Hotstar)
- KT Corporation (Olleh TV)
- Rakuten Group (Rakuten Viki)
- Sky Group Limited (NOW)
- Telstra Corporation (Telstra TV Box Office)
- PCCW Media (Viu)
- Globoplay (Grupo Globo)
- Shahid (MBC Group)
- Showmax (MultiChoice)
- Canal+ Group (myCanal)
- Vubiquity Inc.
Additional Benefits:
- The market estimate (ME) sheet in Excel format
- 3 months of analyst support
TABLE OF CONTENTS
1 INTRODUCTION
- 1.1 Study Assumptions and Market Definition
- 1.2 Scope of the Study
2 RESEARCH METHODOLOGY
3 EXECUTIVE SUMMARY
4 MARKET LANDSCAPE
- 4.1 Market Overview
- 4.2 Market Drivers
- 4.2.1 Rapid adoption of AVOD platforms in emerging Asia-Pacific markets
- 4.2.2 Expansion of ultra-high-speed broadband rollout in North America and Western Europe
- 4.2.3 Increased content investments in local-language originals by global streamers
- 4.2.4 Bundling of VoD with telecom and pay-TV subscriptions driving uptake in South America
- 4.2.5 Growing adoption of cloud-native CDN and edge compute lowering VoD latency
- 4.3 Market Restraints
- 4.3.1 Escalating content licensing costs squeezing platform margins
- 4.3.2 Intensifying antitrust scrutiny over exclusive content deals in EU
- 4.3.3 Rising churn rates due to subscription fatigue in matured SVOD markets
- 4.4 Regulatory Outlook
- 4.5 Porter's Five Forces Analysis
- 4.5.1 Bargaining Power of Buyers
- 4.5.2 Bargaining Power of Suppliers
- 4.5.3 Threat of New Entrants
- 4.5.4 Threat of Substitutes
- 4.5.5 Intensity of Competitive Rivalry
5 MARKET SIZE AND GROWTH FORECASTS (VALUE)
- 5.1 By Business Model
- 5.1.1 Subscription Video-on-Demand (SVOD)
- 5.1.2 Advertising Video-on-Demand (AVOD)
- 5.1.3 Transactional/Pay-per-view (TVOD)
- 5.1.4 Hybrid and Other Models
- 5.2 By Delivery Technology
- 5.2.1 Over-the-Top (OTT) Streaming
- 5.2.2 Internet Protocol Television (IPTV) VoD
- 5.2.3 Pay-TV VoD
- 5.2.4 Hybrid Broadcast Broadband TV (HbbTV)
- 5.3 By Device Type
- 5.3.1 Smartphones and Tablets
- 5.3.2 Smart TVs
- 5.3.3 PCs and Laptops
- 5.3.4 Connected Streaming Devices
- 5.3.5 Others
- 5.4 By Content Genre
- 5.4.1 Entertainment and Drama
- 5.4.2 Sports
- 5.4.3 Kids and Family
- 5.4.4 Educational and Documentary
- 5.4.5 Others (News, Lifestyle)
- 5.5 By End-user
- 5.5.1 Residential / Individual
- 5.5.2 Commercial and Enterprise (Hotels, Airlines, Hospitals)
- 5.5.3 Educational Institutions
- 5.5.4 Public Sector and Government
- 5.6 By Geography
- 5.6.1 North America
- 5.6.1.1 United States
- 5.6.1.2 Canada
- 5.6.1.3 Mexico
- 5.6.2 South America
- 5.6.2.1 Brazil
- 5.6.2.2 Argentina
- 5.6.2.3 Rest of South America
- 5.6.3 Europe
- 5.6.3.1 Germany
- 5.6.3.2 United Kingdom
- 5.6.3.3 France
- 5.6.3.4 Italy
- 5.6.3.5 Spain
- 5.6.3.6 Rest of Europe
- 5.6.4 Asia-Pacific
- 5.6.4.1 China
- 5.6.4.2 Japan
- 5.6.4.3 South Korea
- 5.6.4.4 India
- 5.6.4.5 Australia
- 5.6.4.6 New Zealand
- 5.6.4.7 Rest of Asia-Pacific
- 5.6.5 Middle East and Africa
- 5.6.5.1 United Arab Emirates
- 5.6.5.2 Saudi Arabia
- 5.6.5.3 South Africa
- 5.6.5.4 Rest of Middle East and Africa
- 5.6.1 North America
6 COMPETITIVE LANDSCAPE
- 6.1 Strategic Developments
- 6.2 Vendor Positioning Analysis
- 6.3 Company Profiles (includes Global level Overview, Market level overview, Core Segments, Financials as available, Strategic Information, Products and Services, and Recent Developments)
- 6.3.1 Amazon.com Inc. (Prime Video)
- 6.3.2 Netflix Inc.
- 6.3.3 The Walt Disney Company (Disney+ and Hulu)
- 6.3.4 Warner Bros. Discovery Inc. (Max)
- 6.3.5 Apple Inc. (Apple TV+)
- 6.3.6 Alphabet Inc. (YouTube Premium and YouTube TV)
- 6.3.7 Comcast Corporation (Peacock and Xfinity On-Demand)
- 6.3.8 Paramount Global (Paramount+)
- 6.3.9 Roku Inc.
- 6.3.10 Tencent Holdings Ltd. (Tencent Video)
- 6.3.11 Alibaba Group (Youku Tudou)
- 6.3.12 Baidu Inc. (iQIYI)
- 6.3.13 Zee Entertainment Enterprises Ltd. (ZEE5)
- 6.3.14 Reliance Industries Ltd. (JioCinema)
- 6.3.15 Novi Digital Entertainment Pvt. Ltd. (Disney+ Hotstar)
- 6.3.16 KT Corporation (Olleh TV)
- 6.3.17 Rakuten Group (Rakuten Viki)
- 6.3.18 Sky Group Limited (NOW)
- 6.3.19 Telstra Corporation (Telstra TV Box Office)
- 6.3.20 PCCW Media (Viu)
- 6.3.21 Globoplay (Grupo Globo)
- 6.3.22 Shahid (MBC Group)
- 6.3.23 Showmax (MultiChoice)
- 6.3.24 Canal+ Group (myCanal)
- 6.3.25 Vubiquity Inc.
7 MARKET OPPORTUNITIES AND FUTURE OUTLOOK
- 7.1 White-space and Unmet-Need Assessment

