
PUBLISHER: Mordor Intelligence | PRODUCT CODE: 1851771

PUBLISHER: Mordor Intelligence | PRODUCT CODE: 1851771
Propane - Market Share Analysis, Industry Trends & Statistics, Growth Forecasts (2025 - 2030)
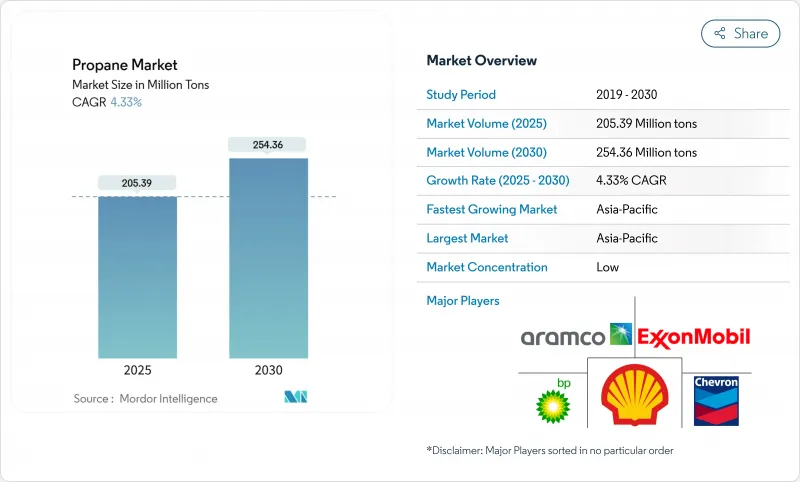
The Propane Market size is estimated at 205.39 Million tons in 2025, and is expected to reach 254.36 Million tons by 2030, at a CAGR of 4.33% during the forecast period (2025-2030).
Demand is benefiting from propane's comparatively low carbon intensity, its cost advantage over electricity in many rural and suburban locations, and its growing role as a petrochemical feedstock. Cylinder distribution, expanding last-mile networks, and safety upgrades are broadening access across emerging economies, while bio-propane investment is accelerating as producers target sharp life-cycle emission cuts. Autogas programs, tax credits for low-emission fuels, and school-bus fleet conversions are enlarging transportation demand, whereas resilient agricultural consumption continues to underpin seasonal offtake. On the supply side, robust natural-gas liquids production in North America and new propane dehydrogenation (PDH) capacity in Asia are anchoring liquidity, even as spot NGL price swings challenge independent marketers.
Global Propane Market Trends and Insights
Residential demand resilience despite electrification push
Lower-carbon heating mandates did not erode core residential consumption, which accounted for 40% of global offtake in 2024. Natural-gas or propane-heated homes in the United States saved an average of USD 1,132 a year relative to all-electric dwellings, reinforcing propane's cost proposition. Rural dependence is pronounced, with more than 24 million US households relying on propane, especially across the Midwest. Although Massachusetts ended most equipment rebates in 2024, incentives for high-efficiency units remained for low-income residents, signalling policy pragmatism. Retail prices softened nationwide-averaging USD 2.475 per gallon in May 2024-helping maintain demand. These dynamics are expected to uphold moderate growth in mature markets even as heat-pump adoption rises.
Industrial applications driving higher growth rates
Industrial uptake is outpacing overall growth, advancing at a 5.25% CAGR as petrochemical producers add dedicated PDH plants to convert propane into propylene. New Asian projects accelerated propylene output in 2024, narrowing spreads yet widening propane throughput. Sustainability targets are prompting operators to trial carbon-capture solutions and renewable-propane blending to curb Scope 1 emissions without compromising process efficiency. The combination of feedstock reliability and de-risked decarbonization paths positions industry demand as a durable growth pillar across the forecast horizon.
Spot NGL price volatility
Propane prices remain sensitive to crude-oil swings and inventory cycles, compressing marketing margins for independent distributors. The Conway Index illustrates Midwest price dips during bumper shale output, followed by sharp spikes in high-demand winters, complicating hedging strategies. Volatility discourages capital investment in storage infrastructure among smaller firms and can slow autogas station roll-outs, marginally tempering near-term market expansion.
Other drivers and restraints analyzed in the detailed report include:
- Bio-propane: transformative growth amid decarbonization
- Transportation sector: autogas expansion despite EV competition
- Storage and safety risks
For complete list of drivers and restraints, kindly check the Table Of Contents.
Segment Analysis
Non-associated gas yielded 52% of global supply in 2024, anchored by prolific shale development and midstream build-outs. The United States alone produced 3.0 million barrels per day of NGLs-including propane-in 2025, up 10% on the previous year. Incremental cryogenic processing in the Permian Basin and Appalachian region secured feedstock continuity, ensuring a stable base for the propane market. Refinery and associated-gas streams provided complementary volumes but grew more slowly, constrained by refinery utilization ceilings and flaring-reduction initiatives.
Bio-propane's 9.20% CAGR underscores its pivotal role in the energy-transition narrative. Capacity expansions at dedicated hydrotreated-vegetable-oil (HVO) units and co-processing lines are set to lift global renewable-propane output from 19,000 barrels per day in 2023 to 51,000 barrels per day by 2025. Developing economies in Southeast Asia and Latin America are also piloting waste-oil pathways, broadening geographic supply diversity. As renewable certification schemes mature, traders expect price premiums to compress, fostering mainstream uptake across residential blends and industrial furnaces.
The Propane Market Report is Segmented by Source (Refinery, Associated Gas, Non-Associated Gas, and Bio-Propane), End-User Industry (Residential, Commercial, Industrial, Transportation, and More), Distribution Channel (Bulk Delivery, Cylinder Distribution, and More), and Geography (Asia-Pacific, North America, Europe, South America, and Middle East and Africa). The Market Forecasts are Provided in Terms of Volume (tons).
Geography Analysis
Asia Pacific anchored 41% of propane market volumes in 2024 and is forecast to expand at a 6.18% CAGR to 2030, buoyed by industrialization, population growth, and supportive LPG adoption schemes. Chinese consumption climbed to 73.9 million tons in 2022 and continues to climb as PDH capacity ramps to satisfy polypropylene demand in automotive interiors and consumer packaging. India's Pradhan Mantri Ujjwala Yojana keeps rural cylinder penetration rising, aiding household fuel switching. Canadian exporter AltaGas plans to double Ridley Island propane export throughput by 2026, underscoring the supply-chain link between North America and Asian buyers.
North America retains a substantial production and export surplus. US shipments reached 1.8 million barrels per day in 2024, marking the 17th consecutive annual increase. Ample shale gas liquids and expanding Gulf Coast dock capacity ensure reliable feedstock for global customers. Domestic demand growth is steadier, with residential heating plateauing but autogas and renewable-propane blending providing incremental lift.
Europe confronts mature demand in traditional heating uses but posts vigorous momentum in renewable-propane blending. The Renewable Energy Directive III and fit-for-55 packages incentivize suppliers to decarbonize bulk portfolios and aviation-fuel coproduct streams. Infrastructure repurposing to handle blended molecules positions the region for a gradual supply-mix transition through 2030.
The Middle East and Africa leverage abundant associated-gas streams to feed growing domestic petrochemical ambitions, while South America's market progresses steadily on the back of Brazil's cylinder program expansions and Argentina's agricultural drying needs.
- AltaGas Ltd.
- BP p.l.c.
- Chevron Corporation
- China Petrochemical Corporation
- DCC Plc
- Energy Transfer LP
- Eni SpA
- Enterprise Products Partners L.P.
- Equinor ASA
- Exxon Mobil Corporation
- GAIL (India) Limited
- Gazprom
- Linde PLC
- PDVSA
- PetroChina Company Limited (China National Petroleum Corp.)
- Phillips 66 Company
- Repsol
- Saudi Arabian Oil Co.
- Shell PLC
- SHV Energy
- Suburban Propane
- TotalEnergies
- UGI Corporation
Additional Benefits:
- The market estimate (ME) sheet in Excel format
- 3 months of analyst support
TABLE OF CONTENTS
1 Introduction
- 1.1 Study Assumptions and Market Definition
- 1.2 Scope of the Study
2 Research Methodology
3 Executive Summary
4 Market Landscape
- 4.1 Market Overview
- 4.2 Market Drivers
- 4.2.1 Increase in Demand from the Residential Sectors
- 4.2.2 Demand in the Petrochemical Industry
- 4.2.3 Government-Mandated Bio-Propane Blending Targets in the Europe Transport Sector (Europe)
- 4.2.4 Rising Demand in Agriculture
- 4.2.5 Increase in Demand from the Transportation Sector
- 4.3 Market Restraints
- 4.3.1 Harmful Effects of Propane at Higher Concentrations
- 4.3.2 Spot NGL Price Volatility Compressing Margins for Independent Marketers (Global)
- 4.3.3 Storage and Safety Risks
- 4.4 Value Chain Analysis
- 4.5 Porter's Five Forces
- 4.5.1 Bargaining Power of Suppliers
- 4.5.2 Bargaining Power of Buyers
- 4.5.3 Threat of New Entrants
- 4.5.4 Threat of Substitutes
- 4.5.5 Degree of Competition
5 Market Size and Growth Forecasts (Volume)
- 5.1 By Source
- 5.1.1 Refinery
- 5.1.2 Associated Gas
- 5.1.3 Non-Associated Gas
- 5.1.4 Bio-Propane
- 5.2 By End-user Industry
- 5.2.1 Residential
- 5.2.2 Commercial
- 5.2.3 Industrial
- 5.2.4 Transportation
- 5.2.5 Other End-user Industries
- 5.3 By Distribution Channel
- 5.3.1 Bulk Delivery
- 5.3.2 Cylinder Distribution
- 5.3.3 Autogas Refueling Network
- 5.3.4 Retail Packaged (1-lb and Camping)
- 5.4 By Geography
- 5.4.1 Asia-Pacific
- 5.4.1.1 China
- 5.4.1.2 India
- 5.4.1.3 Japan
- 5.4.1.4 South Korea
- 5.4.1.5 Rest of Asia-Pacific
- 5.4.2 North America
- 5.4.2.1 United States
- 5.4.2.2 Canada
- 5.4.2.3 Mexico
- 5.4.3 Europe
- 5.4.3.1 Germany
- 5.4.3.2 United Kingdom
- 5.4.3.3 Italy
- 5.4.3.4 France
- 5.4.3.5 Rest of Europe
- 5.4.4 South America
- 5.4.4.1 Brazil
- 5.4.4.2 Argentina
- 5.4.4.3 Rest of South America
- 5.4.5 Middle East and Africa
- 5.4.5.1 Saudi Arabia
- 5.4.5.2 South Africa
- 5.4.5.3 Rest of Middle East and Africa
- 5.4.1 Asia-Pacific
6 Competitive Landscape
- 6.1 Market Concentration
- 6.2 Strategic Moves
- 6.3 Market Share Analysis
- 6.4 Company Profiles {(includes Global level Overview, Market level overview, Core Segments, Financials as available, Strategic Information, Market Rank/Share for key companies, Products and Services, and Recent Developments)}
- 6.4.1 AltaGas Ltd.
- 6.4.2 BP p.l.c.
- 6.4.3 Chevron Corporation
- 6.4.4 China Petrochemical Corporation
- 6.4.5 DCC Plc
- 6.4.6 Energy Transfer LP
- 6.4.7 Eni SpA
- 6.4.8 Enterprise Products Partners L.P.
- 6.4.9 Equinor ASA
- 6.4.10 Exxon Mobil Corporation
- 6.4.11 GAIL (India) Limited
- 6.4.12 Gazprom
- 6.4.13 Linde PLC
- 6.4.14 PDVSA
- 6.4.15 PetroChina Company Limited (China National Petroleum Corp.)
- 6.4.16 Phillips 66 Company
- 6.4.17 Repsol
- 6.4.18 Saudi Arabian Oil Co.
- 6.4.19 Shell PLC
- 6.4.20 SHV Energy
- 6.4.21 Suburban Propane
- 6.4.22 TotalEnergies
- 6.4.23 UGI Corporation
7 Market Opportunities and Future Outlook
- 7.1 White-space and Unmet-Need Assessment
- 7.2 Usage of Propane in Power Generation

