
PUBLISHER: Mordor Intelligence | PRODUCT CODE: 1851800

PUBLISHER: Mordor Intelligence | PRODUCT CODE: 1851800
Digital Map - Market Share Analysis, Industry Trends & Statistics, Growth Forecasts (2025 - 2030)
The digital map market is valued at USD 28.97 billion in 2025 and is projected to reach USD 54.30 billion by 2030, advancing at a 13.39% CAGR.
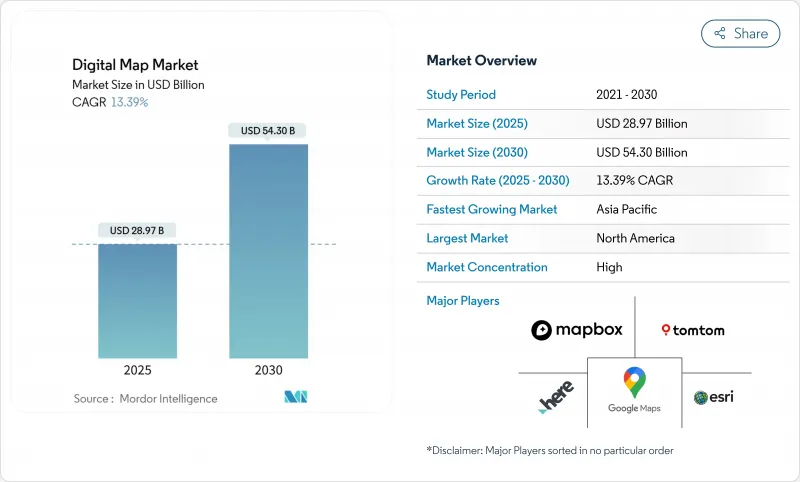
Growth stems from the transition toward AI-powered, cloud-native platforms that support autonomous vehicles, smart-city digital twins, and real-time geographic information systems. Regulatory mandates such as EU eCall and emerging corporate Scope 3 carbon-mapping rules broaden adoption beyond conventional navigation.
Global Digital Map Market Trends and Insights
Rapid Uptake of HD Maps for ADAS and Autonomous Vehicles
BMW launched Germany's first Level 3 system in 2024 using HERE HD Live Map that delivers lane-level accuracy within 17 cm for localization, path planning, and operational-design-domain validation. HERE's high-precision coverage now supports 53 million vehicles, a 40% rise over 2023, indicating OEM reliance on turnkey HD data. TomTom's Orbis Maps 3D spans 86 million km of roads and integrates lane-based navigation with electric-vehicle charging layers. Japan's Dynamic Map Platform received government backing in 2025 to expand HD maps to airports and ports, targeting Level 4 autonomous trucks. AI-based feature extraction lowers refresh costs and shortens map-creation cycles, delivering competitive advantage to providers able to update networks in near-real time.
Explosive Growth of Connected-Car OTA Map-Update Ecosystems
Connected vehicles are shifting maps from static licenses to recurring over-the-air services. HARMAN's Smart Delta technology compresses map-update files by up to 97%, cutting data-transfer costs while maintaining software-defined-vehicle safety integrity. Nine of ten global OEMs deploy HERE's Intelligent Speed Assistance Map to address EU General Safety Regulation compliance, creating standardized OTA pathways for fleet-wide updates. Mercedes-Benz integrated electric-intelligence and off-road tracking features via its January 2025 OTA release, illustrating how map data enables post-sale feature monetization.
Escalating Costs of Continuous, Centimeter-Level Map Refresh
Lane-level refresh requirements drive substantial operational costs as construction and traffic changes intensify in urban zones. TomTom now fuses multi-sensor data-satellite, LiDAR, onboard cameras-to automate feature extraction and cut survey cycles. GetNexar's AI vision reduces cartography expense by crowd-sourcing dash-cam imagery, yet capital requirements remain onerous for smaller vendors. Cost pressures encourage alliances and selective outsourcing to maintain update cadence without sacrificing map accuracy.
Other drivers and restraints analyzed in the detailed report include:
- Mainstream Adoption of Cloud-Native GIS Platforms
- Smart-City Digital-Twin Programs Scaling Globally
- Heightened Data-Privacy and Localization Statutes (GDPR, PIPL)
For complete list of drivers and restraints, kindly check the Table Of Contents.
Segment Analysis
Software solutions captured 61.40% of the digital map market in 2024, reflecting enterprise demand for configurable, API-driven platforms that consolidate spatial analytics across departments. Feature-rich SDKs allow developers to embed maps, routing, and geocoding into mobility, logistics, and retail applications. Services revenue, growing at 13.50% CAGR, mirrors rising complexity as organizations migrate legacy GIS to cloud environments and seek managed integration, data-quality tuning, and user-enablement programs. AI modules within modern platforms automate line-mark detection, sign recognition, and asset-condition scoring, catalyzing operational efficiencies.
Professional-services uptake also reflects compliance mandates that require expert audits of location-data pipelines. Documentation, consent-management tools, and geo-fencing policy engines are bundled into implementation projects to ensure lawful deployment across borders. As enterprise data volumes scale, vendor-operated managed services increasingly handle ingestion, normalization, and near-real-time streaming, locking in recurring revenue beyond one-time license fees.
Cloud deployment held 65.70% share of the digital map market size in 2024 and is forecast to expand at 15.70% CAGR through 2030. Elastic compute and storage enable sub-second query performance for billions of daily route requests while auto-scaling manages traffic peaks during severe-weather or holiday seasons. Edge ingestion nodes push fresh probe data into centralized repositories, ensuring map freshness for ride-hailing, logistics, and emergency response.
On-premise installations persist in defense, aviation, and highly regulated finance but trend downward as sovereign-cloud regions, dedicated host options, and confidential-computing enclaves mitigate security objections. Cost models shift from capex to pay-as-you-go opex, freeing capital for AI experimentation and cross-domain data fusion. Enterprises increasingly view mapping as a micro-service consumed within broader data-platform strategies rather than a standalone GIS function.
Digital Map Market is Segmented by Solution (Software, Services), Deployment (On-Premise, Cloud), Map Type (Navigation Maps, HD and Real-Time Maps, Topographic and Thematic Maps), End User Industry (Automotive, Engineering and Construction, Telecommunications and More), and by Geography. The Market Forecasts are Provided in Terms of Value (USD).
Geography Analysis
North America accounted for 29.6% digital map market share in 2024, anchored by early adoption of software-defined vehicles, cloud GIS, and defense geospatial programs. Federal agencies promote open spatial frameworks, and automotive OEMs maintain deep research pipelines for automation. Large-scale infrastructure projects employ digital terrain models and GNSS machine-control to shorten build cycles and enhance asset lifecycle visibility. Data-monetization champions such as fleet telematics providers continuously feed anonymized probe data that sustain regional map accuracy.
Asia-Pacific delivers the highest 15.4% CAGR through 2030, powered by 5G subscriber growth, smart-mobility funding, and government-backed digital-twin mandates. Japan's industry collects HD corridor data for truck platooning and metropolitan robo-taxi pilots, accelerating HD mapping demand. China's cloud providers expose high-volume location APIs to power e-commerce logistics, while India's 5G networks stimulate GIS modernization across utilities and agriculture. Investments in regional hyperscale data centers also address data-sovereignty rules, enabling global vendors to serve local customers via in-country endpoints.
- Alphabet (Google Maps, Waze)
- HERE Technologies
- TomTom International B.V.
- Esri
- Mapbox
- Apple Inc. (Apple Maps)
- Maxar Technologies (DigitalGlobe)
- Collins Bartholomew
- Digital Map Products
- Digital Mapping Solutions
- DMTI Spatial
- Lepton Software
- ThinkGeo
- MapData Services
- NavInfo Co. Ltd.
- AutoNavi (Gaode, Alibaba)
- Baidu Maps
- Nearmap Ltd
- Zenrin Co. Ltd.
- Trimble Inc.
- CARTO
- OpenStreetMap Foundation
- MapQuest (Verizon)
Additional Benefits:
- The market estimate (ME) sheet in Excel format
- 3 months of analyst support
TABLE OF CONTENTS
1 INTRODUCTION
- 1.1 Study Assumptions and Market Definition
- 1.2 Scope of the Study
2 RESEARCH METHODOLOGY
3 EXECUTIVE SUMMARY
4 MARKET LANDSCAPE
- 4.1 Market Overview
- 4.2 Market Drivers
- 4.2.1 Rapid uptake of HD maps for ADAS and autonomous vehicles
- 4.2.2 Explosive growth of connected-car OTA map-update ecosystems
- 4.2.3 Mainstream adoption of cloud-native GIS platforms
- 4.2.4 Smart-city digital-twin programs scaling globally
- 4.2.5 Mandatory EU eCall and next-gen road-safety regulations
- 4.2.6 Corporate Scope-3 carbon mapping requirements
- 4.3 Market Restraints
- 4.3.1 Escalating costs of continuous, centimetre-level map refresh
- 4.3.2 Heightened data-privacy and localization statutes (GDPR, PIPL)
- 4.3.3 IP-licensing disputes among data providers and OEMs
- 4.3.4 Algorithmic bias and liability concerns in AI-generated maps
- 4.4 Value / Supply-Chain Analysis
- 4.5 Regulatory Landscape
- 4.6 Technological Outlook
- 4.7 Porter's Five Forces
- 4.7.1 Threat of New Entrants
- 4.7.2 Bargaining Power of Buyers
- 4.7.3 Bargaining Power of Suppliers
- 4.7.4 Threat of Substitutes
- 4.7.5 Intensity of Competitive Rivalry
5 MARKET SIZE AND GROWTH FORECASTS (VALUE)
- 5.1 By Solution
- 5.1.1 Software
- 5.1.2 Services
- 5.2 By Deployment
- 5.2.1 On-Premise
- 5.2.2 Cloud
- 5.3 By Map Type
- 5.3.1 Navigation Maps
- 5.3.2 HD and Real-time Maps
- 5.3.3 Topographic and Thematic Maps
- 5.4 By End-use Industry
- 5.4.1 Automotive
- 5.4.2 Engineering and Construction
- 5.4.3 Telecommunications
- 5.4.4 Public Sector and Defense
- 5.4.5 Retail and Geomarketing
- 5.4.6 Other End User
- 5.5 By Geography
- 5.5.1 North America
- 5.5.1.1 United States
- 5.5.1.2 Canada
- 5.5.1.3 Mexico
- 5.5.2 South America
- 5.5.2.1 Brazil
- 5.5.2.2 Argentina
- 5.5.2.3 Rest of South America
- 5.5.3 Europe
- 5.5.3.1 Germany
- 5.5.3.2 United Kingdom
- 5.5.3.3 France
- 5.5.3.4 Netherlands
- 5.5.3.5 Rest of Europe
- 5.5.4 Asia-Pacific
- 5.5.4.1 China
- 5.5.4.2 Japan
- 5.5.4.3 India
- 5.5.4.4 South Korea
- 5.5.4.5 Australia and New Zealand
- 5.5.4.6 Rest of Asia-Pacific
- 5.5.5 Middle East and Africa
- 5.5.5.1 Middle East
- 5.5.5.1.1 United Arab Emirates
- 5.5.5.1.2 Saudi Arabia
- 5.5.5.1.3 Turkey
- 5.5.5.1.4 Rest of Middle East
- 5.5.5.2 Africa
- 5.5.5.2.1 South Africa
- 5.5.5.2.2 Nigeria
- 5.5.5.2.3 Rest of Africa
- 5.5.1 North America
6 COMPETITIVE LANDSCAPE
- 6.1 Market Concentration
- 6.2 Strategic Moves
- 6.3 Market Share Analysis
- 6.4 Company Profiles (includes Global level Overview, Market level overview, Core Segments, Financials as available, Strategic Information, Market Rank/Share for key companies, Products and Services, and Recent Developments)
- 6.4.1 Alphabet (Google Maps, Waze)
- 6.4.2 HERE Technologies
- 6.4.3 TomTom International B.V.
- 6.4.4 Esri
- 6.4.5 Mapbox
- 6.4.6 Apple Inc. (Apple Maps)
- 6.4.7 Maxar Technologies (DigitalGlobe)
- 6.4.8 Collins Bartholomew
- 6.4.9 Digital Map Products
- 6.4.10 Digital Mapping Solutions
- 6.4.11 DMTI Spatial
- 6.4.12 Lepton Software
- 6.4.13 ThinkGeo
- 6.4.14 MapData Services
- 6.4.15 NavInfo Co. Ltd.
- 6.4.16 AutoNavi (Gaode, Alibaba)
- 6.4.17 Baidu Maps
- 6.4.18 Nearmap Ltd
- 6.4.19 Zenrin Co. Ltd.
- 6.4.20 Trimble Inc.
- 6.4.21 CARTO
- 6.4.22 OpenStreetMap Foundation
- 6.4.23 MapQuest (Verizon)
7 MARKET OPPORTUNITIES AND FUTURE OUTLOOK
- 7.1 White-space and Unmet-need Assessment

