
PUBLISHER: Mordor Intelligence | PRODUCT CODE: 1851992

PUBLISHER: Mordor Intelligence | PRODUCT CODE: 1851992
Desalination System - Market Share Analysis, Industry Trends & Statistics, Growth Forecasts (2025 - 2030)
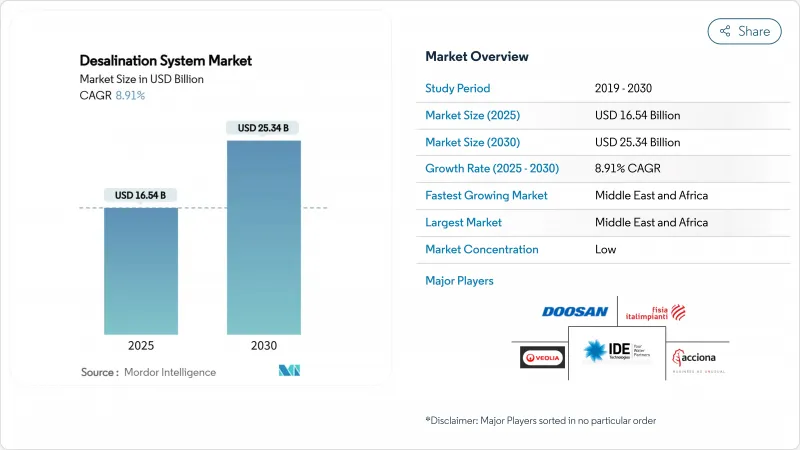
The Desalination System Market size is estimated at USD 16.54 billion in 2025, and is expected to reach USD 25.34 billion by 2030, at a CAGR of 8.91% during the forecast period (2025-2030).
Persistent water scarcity, rapid coastal urbanization, and sovereign-backed public-private partnerships (PPPs) are anchoring demand, while reverse-osmosis (RO) energy intensity has fallen below 3 kWh m3, widening the addressable opportunity set. Integrated energy-recovery devices now recuperate up to 60% of brine-stream pressure, pushing the desalination system market toward sub-USD 0.50 m3 production benchmarks. Project sponsors in the Middle East and North Africa (MENA) deploy long-dated offtake agreements that de-risk multi-billion-dollar plants, and semiconductor manufacturers in Asia-Pacific accelerate industrial reuse mandates.
Global Desalination System Market Trends and Insights
Rapid Municipal Water Demand in MENA
Municipal scarcity has repositioned desalination from supplemental infrastructure to cornerstone supply across MENA. Morocco targets 1.4 billion m3 year-1 by 2030 under its National Water Plan, while Algeria budgeted USD 3 billion for new capacity and Egypt commissioned the world's largest RO station. Guaranteed municipal offtake contracts stabilize cash flows, permitting operators to deploy large-capacity trains that drive unit costs below USD 0.50 m3. Urbanization around Gulf megacities sustains continuous offtake, enabling scale that further fuels the desalination system market.
Industrial Reuse Mandates (Semiconductor, Pharma)
Chip fabrication now migrates to water-stressed APAC hubs, where closed-loop reuse can cut freshwater withdrawals by 95%. Zero-liquid-discharge (ZLD) directives in semiconductor and pharmaceutical clusters create price-inelastic demand for ultrahigh-recovery membranes. Facilities integrate stage-two RO and electrodialysis reversal polishing to meet 0.1 µS cm-1 conductivity targets, lifting the desalination system market's industrial revenue mix. Regulatory certainty enables premium pricing, cushioning suppliers from cyclical downturns.
RO Membrane Fouling and Scaling
Bio- and organic fouling can cut flux 30% within months, forcing more frequent chemical cleans that add USD 0.10-0.15 m3 to OPEX. Scaling from CaCO3 and CaSO4 raises feed pressure, spiking energy consumption. Although graphene-oxide layers boost hydrophilicity, commercial roll-out remains nascent due to cost premiums and longevity unknowns. Operators now install AI-driven pretreatment control to prolong membrane life, but fouling still tempers the desalination system market growth in harsh-salinity locales.
Other drivers and restraints analyzed in the detailed report include:
- Falling RO CAPEX and Energy-Recovery Costs
- Green-Hydrogen Cluster Demand (Coastal Deserts)
- Environmental Impact of Brine Discharge
For complete list of drivers and restraints, kindly check the Table Of Contents.
Segment Analysis
Membrane processes accounted for 78.92% of the desalination system market share in 2024, and this slice is widening at a 10.70% CAGR as RO energy falls below 3 kWh m3. RO remains the workhorse, yet electrodialysis reversal is carving brackish niches under 3 g L-1 salinity where its 1.5 kWh m3 footprint excels.
Nanofiltration advances with ultra-negative charge densities now capture endocrine disruptors for pharmaceutical ZLD lines. Thermal methods persist in Gulf cogeneration complexes, but their share recedes as integrated PV and energy-recovery narrow the levelized-cost gap, reinforcing membrane ascendancy within the desalination system market.
The Desalination System Report is Segmented by Technology of Separation (Thermal Technology and Membrane Technology), Application (Municipal and Industrial), and Geography (Asia-Pacific, North America, Europe, South America, and Middle-East and Africa). The Market Forecasts are Provided in Terms of Value (USD).
Geography Analysis
Middle East and Africa captured 52.70% of the desalination system market share in 2024 and is advancing at 10.62% CAGR through 2030, sustained by sovereign-funded mega-projects and abundant solar resources. Saudi Arabia's and the UAE's gigawatt PV-RO hybrids exemplify how integrated renewables trim operating costs and carbon profiles.
North America is entering an inflection phase: Texas approved the USD 757 million Corpus Christi plant, the largest U.S. seawater RO facility, while California streamlined permits for coastal RO and direct potable reuse. Technology vendors such as Energy Recovery and DuPont leverage local reference projects to demonstrate AI-driven predictive maintenance that cuts downtime by 15%, further enlarging the desalination system market.
Asia-Pacific and Europe are consolidating their positions. Singapore's Keppel Marina East blends public recreation with underground RO pipes, showcasing aesthetic integration. Spain, reliant on desalination for drought resilience, upgrades legacy multi-stage flash units with high-pressure RO, achieving 40% energy savings.
- Acciona
- Aquatech
- Biwater Holdings Limited
- Doosan Enerbility
- DuPont
- Energy Recovery Inc.
- Fisia Italimpianti
- Fluence Corporation Limited
- IDE
- Kanadevia Corporation
- Metito Utilities
- Ocean Oasis
- Toray Industries Inc
- Veolia
- Wabag
- Xylem
Additional Benefits:
- The market estimate (ME) sheet in Excel format
- 3 months of analyst support
TABLE OF CONTENTS
1 Introduction
- 1.1 Study Assumptions and Market Definition
- 1.2 Scope of the Study
2 Research Methodology
3 Executive Summary
4 Market Landscape
- 4.1 Market Overview
- 4.2 Market Drivers
- 4.2.1 Rapid Municipal Water Demand in MENA
- 4.2.2 Industrial Reuse Mandates (Semiconductor, Pharma)
- 4.2.3 Falling RO CAPEX and Energy-Recovery Costs
- 4.2.4 Green-Hydrogen Cluster Demand (Coastal Deserts)
- 4.2.5 Sovereign Water-Security Funds Underwriting PPPs
- 4.3 Market Restraints
- 4.3.1 RO Membrane Fouling and Scaling
- 4.3.2 Environmental Impact of Brine Discharge
- 4.3.3 High Project CAPEX Sensitivity to Energy Prices
- 4.4 Value Chain Analysis
- 4.5 Porter's Five Forces
- 4.5.1 Bargaining Power of Suppliers
- 4.5.2 Bargaining Power of Buyers
- 4.5.3 Threat of New Entrants
- 4.5.4 Threat of Substitutes
- 4.5.5 Competitive Rivalry
5 Market Size and Growth Forecasts (Value)
- 5.1 By Technology of Separation
- 5.1.1 Thermal Technology
- 5.1.1.1 Multi-stage Flash Distillation (MSF)
- 5.1.1.2 Multi-effect Distillation (MED)
- 5.1.1.3 Vapor Compression Distillation
- 5.1.2 Membrane Technology
- 5.1.2.1 Electrodialysis (ED)
- 5.1.2.2 Electrodialysis Reversal (EDR)
- 5.1.2.3 Reverse Osmosis (RO)
- 5.1.2.4 Other Membrane Technologies (Nanofiltration, Ultrafiltration, Microfiltration)
- 5.1.1 Thermal Technology
- 5.2 By Application
- 5.2.1 Municipal
- 5.2.2 Industrial
- 5.3 By Geography
- 5.3.1 Asia-Pacific
- 5.3.1.1 China
- 5.3.1.2 India
- 5.3.1.3 Japan
- 5.3.1.4 Rest of Asia-Pacific
- 5.3.2 North America
- 5.3.2.1 United States
- 5.3.2.2 Mexico
- 5.3.3 South America
- 5.3.3.1 Brazil
- 5.3.3.2 Chile
- 5.3.3.3 Rest of South America
- 5.3.4 Europe
- 5.3.4.1 Germany
- 5.3.4.2 United Kingdom
- 5.3.4.3 Spain
- 5.3.4.4 Rest of Europe
- 5.3.5 Middle-East and Africa
- 5.3.5.1 Saudi Arabia
- 5.3.5.2 United Arab Emirates
- 5.3.5.3 Algeria
- 5.3.5.4 Egypt
- 5.3.5.5 Rest of Middle-East and Africa
- 5.3.1 Asia-Pacific
6 Competitive Landscape
- 6.1 Market Concentration
- 6.2 Strategic Moves
- 6.3 Market Share (%)**/Ranking Analysis
- 6.4 Company Profiles (includes Global level Overview, Market level overview, Core Segments, Financials as available, Strategic Information, Market Rank/Share for key companies, Products and Services, and Recent Developments)
- 6.4.1 Acciona
- 6.4.2 Aquatech
- 6.4.3 Biwater Holdings Limited
- 6.4.4 Doosan Enerbility
- 6.4.5 DuPont
- 6.4.6 Energy Recovery Inc.
- 6.4.7 Fisia Italimpianti
- 6.4.8 Fluence Corporation Limited
- 6.4.9 IDE
- 6.4.10 Kanadevia Corporation
- 6.4.11 Metito Utilities
- 6.4.12 Ocean Oasis
- 6.4.13 Toray Industries Inc
- 6.4.14 Veolia
- 6.4.15 Wabag
- 6.4.16 Xylem
7 Market Opportunities and Future Outlook
- 7.1 White-space and Unmet-Need Assessment
- 7.2 Upcoming Desalination Projects

