
PUBLISHER: Mordor Intelligence | PRODUCT CODE: 1906068

PUBLISHER: Mordor Intelligence | PRODUCT CODE: 1906068
Singapore Maritime - Market Share Analysis, Industry Trends & Statistics, Growth Forecasts (2026 - 2031)
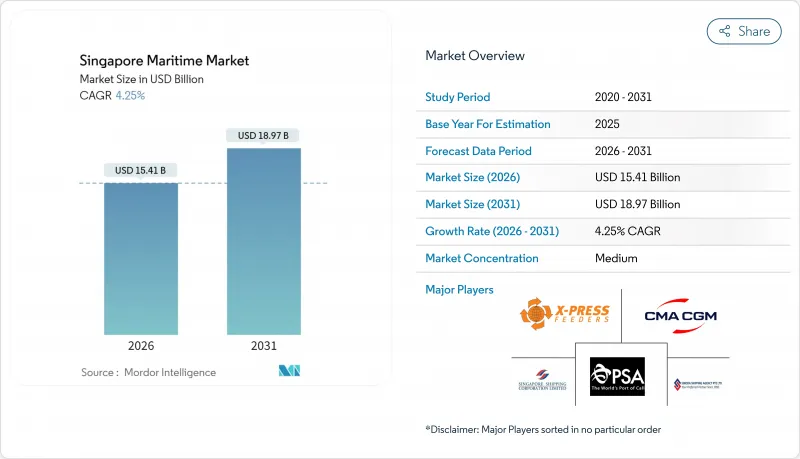
The Maritime Sector In Singapore Market size in 2026 is estimated at USD 15.41 billion, growing from 2025 value of USD 14.78 billion with 2031 projections showing USD 18.97 billion, growing at 4.25% CAGR over 2026-2031.
Accelerated automation at Tuas Port, the electronic bunker-delivery-note mandate, and expanding green-fuel corridors underpin the Maritime Sector in Singapore market's momentum, even as EU Emissions Trading System (EU-ETS) surcharges compress liner margins. Container throughput hit a record 41.12 million TEU in 2024, highlighting the city-state's resilience as a trans-shipment nexus despite Red Sea rerouting disruptions. Bunker volumes of 54.92 million tonnes in 2024 reaffirm Singapore's role as the world's largest bunkering hub, with LNG, methanol, and ammonia trials scaling quickly. Maritime-5G coverage due in mid-2025 promises real-time vessel-traffic coordination, while X-Press Feeders' 21.8% fleet expansion shows how agile operators capture schedule-reliability premiums.
Insights and Trends of Maritime Sector In Singapore
Surge in Mega-Containership Traffic and Hub-Port Trans-Shipment Demand
Ultra-large container vessels exceeding 20,000 TEU now call weekly at Singapore in greater numbers, concentrating cargo into fewer port rotations and magnifying berth-delay penalties. Throughput reached 41.12 million TEU in 2024, about 85% of which was transshipment cargo. Red Sea diversions added up to two weeks on Asia-Europe schedules, pushing 90% of sailings off timetable and funneling overflow to Singapore.Legacy terminals strained under yard-density spikes, prompting the Maritime and Port Authority (MPA) to deploy predictive-analytics berth allocation via digitalPORT@SG, although full effectiveness depends on universal real-time data feeds.
Singapore Government's Tuas Port Capacity Expansion and Full Automation Roadmap
Tuas Port targets 65 million TEU annual capacity by the 2040s, consolidating four legacy terminals into a mega-facility featuring automated guided vehicles, remote-controlled quay cranes, and the iWX digital-twin platform. Phase 1 is operational, and PSA broke ground in October 2024 on a 2 million-sq-ft automated supply-chain hub that integrates customs pre-clearance and warehouse robotics. The SGD 20 billion investment promises labor-cost savings but carries technology-obsolescence risk as regional rivals roll out lower-cost semi-automated terminals.
Red Sea Rerouting Congestion Spikes Exposing Berth/Yard Bottlenecks
Houthi attacks forced Asia-Europe services around the Cape of Good Hope, adding up to 14 days per voyage and removing roughly 15% of effective fleet capacity. Schedule reliability plunged to 10%, driving yard-density surges at legacy Singapore terminals. While digitalPORT@SG reallocates berths dynamically, it depends on accurate arrival forecasts that remain elusive during geopolitical disruptions.
Other drivers and restraints analyzed in the detailed report include:
- Record Bunker-Fuel Volumes and Digital Bunkering Mandate
- Green and Digital Shipping Corridors Accelerating Alternative-Fuel Uptake
- Rising Carbon-Cost Pass-Through (EU-ETS, IMO CII) Eroding Operator Margins
For complete list of drivers and restraints, kindly check the Table Of Contents.
Segment Analysis
Port and Terminal Operations contributed 40.78% to overall 2025 revenue, benefiting from 41.12 million TEU throughput and PSA International's scale. Bunkering Services, although smaller, are set for 4.62% CAGR, the quickest among activities, thanks to the electronic bunker-delivery-note rule and surging alternative-fuel demand. The Maritime Sector in Singapore market size for bunkering is expected to widen steadily as LNG, methanol, and ammonia adoption rises across liner and tanker fleets. Shipping Line Services capture upside from diverted Asia-Europe volumes but bear EU-ETS pass-through costs. Shipbuilding, Repair, and Maintenance accelerate after Seatrium's creation, which consolidated dry-dock capacity and positioned the yard for green-retrofit projects. Maritime Support Services thrive on compliance advisory demand as operators navigate CII ratings and carbon-credit procurement.
Automated berth allocation and Maritime-5G will further lift productivity for terminal activities. Conversely, the fragmented harbour-craft segment drags on electrification targets, limiting near-term emissions gains in port waters. Seatrium's focus on ammonia-ready conversions aligns with Tuas Port's strategy of anchoring full-cycle green-fuel infrastructure within Singapore. Financing and legal advisory firms leverage Singapore's common-law framework to structure green-transition loans, drawing additional professional-services revenue into the Maritime Sector in Singapore market.
The Maritime Sector in Singapore Report is Segmented by Activity (Port and Terminal Operations, Shipping Line Services, Bunkering Services, and More), Vessel Type (Container Vessels, Bulk Carriers, Tankers, Passenger Vessels, Others), End User Industry (Electronics and Semiconductors, Chemicals and Petrochemicals, Food and Beverage, and More). The Market Forecasts are Provided in Terms of Value (USD).
List of Companies Covered in this Report:
- PSA International
- Sinoda Shipping Agency Pte Ltd
- Singapore Shipping Corporation Limited
- Jurong Port Pte Ltd
- X-Press Feeders
- GAC Group
- Hutchison Ports
- Eng Lee Shipping
- Pacmar Shipping
- ASL Marine Holdings Ltd
- Austen Maritime Services Pte Ltd
- Yang Ming Marine Transport
- Eastern Pacific Shipping
- HSD Marine
- Capital Shipping Agency (S) Pte Ltd
- Swire Shipping Pte. Ltd.
- CMA CGM
- Pacific Carriers Limited
- Wilhelmsen Ship Management
- Marsh LLC.
Additional Benefits:
- The market estimate (ME) sheet in Excel format
- 3 months of analyst support
TABLE OF CONTENTS
1 Introduction
- 1.1 Study Assumptions & Market Definition
- 1.2 Scope of the Study
2 Research Methodology
3 Executive Summary
4 Market Landscape
- 4.1 Market Overview
- 4.2 Market Drivers
- 4.2.1 Surge in mega-containership traffic & hub-port trans-shipment demand
- 4.2.2 Singapore Government's Tuas Port capacity expansion & full automation roadmap
- 4.2.3 Record bunker-fuel volumes and first-in-class digital bunkering mandate
- 4.2.4 Green & Digital Shipping Corridors accelerating alternative-fuel uptake
- 4.2.5 Move to integrate air-sea intermodal cargo within 24-hour windows (prototype app)
- 4.2.6 AI-enabled Next-Gen Vessel-Traffic-Management & Maritime-5G coverage
- 4.3 Market Restraints
- 4.3.1 Red-Sea rerouting congestion spikes exposing berth/yard bottlenecks
- 4.3.2 Rising carbon-cost pass-through (EU-ETS, IMO CII) eroding operator margins
- 4.3.3 Fragmented harbour-craft ownership slowing electrification economics
- 4.3.4 Talent pipeline gaps for ammonia/methanol bunkering safety skills
- 4.4 Value / Supply-Chain Analysis
- 4.5 Regulatory Landscape
- 4.6 Technological Outlook
- 4.7 Porter's Five Forces
- 4.7.1 Threat of New Entrants
- 4.7.2 Bargaining Power of Suppliers
- 4.7.3 Bargaining Power of Buyers
- 4.7.4 Threat of Substitutes
- 4.7.5 Industry Rivalry
5 Market Size & Growth Forecasts (Value, 2019-2030)
- 5.1 By Activity
- 5.1.1 Port and Terminal Operations
- 5.1.2 Shipping Line Services (combines cargo and passengers)
- 5.1.3 Bunkering Services
- 5.1.4 Shipbuilding, Repair and Maintenance
- 5.1.5 Maritime Support Services (finance, insurance, broking, legal)
- 5.2 By Vessel Type
- 5.2.1 Container Vessels
- 5.2.2 Bulk Carriers
- 5.2.3 Tankers
- 5.2.4 Passenger Vessels
- 5.2.5 Others
- 5.3 By End User Industry
- 5.3.1 Electronics and Semiconductors
- 5.3.2 Chemicals and Petrochemicals
- 5.3.3 Food and Beverage
- 5.3.4 Pharmaceuticals and Healthcare
- 5.3.5 Retail and E-commerce
- 5.3.6 Others
6 Competitive Landscape
- 6.1 Market Concentration
- 6.2 Strategic Moves
- 6.3 Market Share Analysis
- 6.4 Company Profiles (includes Global level Overview, Market level overview, Core Segments, Financials as available, Strategic Information, Market Rank/Share for key companies, Products & Services, and Recent Developments)
- 6.4.1 PSA International
- 6.4.2 Sinoda Shipping Agency Pte Ltd
- 6.4.3 Singapore Shipping Corporation Limited
- 6.4.4 Jurong Port Pte Ltd
- 6.4.5 X-Press Feeders
- 6.4.6 GAC Group
- 6.4.7 Hutchison Ports
- 6.4.8 Eng Lee Shipping
- 6.4.9 Pacmar Shipping
- 6.4.10 ASL Marine Holdings Ltd
- 6.4.11 Austen Maritime Services Pte Ltd
- 6.4.12 Yang Ming Marine Transport
- 6.4.13 Eastern Pacific Shipping
- 6.4.14 HSD Marine
- 6.4.15 Capital Shipping Agency (S) Pte Ltd
- 6.4.16 Swire Shipping Pte. Ltd.
- 6.4.17 CMA CGM
- 6.4.18 Pacific Carriers Limited
- 6.4.19 Wilhelmsen Ship Management
- 6.4.20 Marsh LLC.
7 Market Opportunities & Future Outlook
- 7.1 White-space & Unmet-Need Assessment

