
PUBLISHER: Mordor Intelligence | PRODUCT CODE: 1906144

PUBLISHER: Mordor Intelligence | PRODUCT CODE: 1906144
Middle East And Africa Biofertilizers - Market Share Analysis, Industry Trends & Statistics, Growth Forecasts (2026 - 2031)
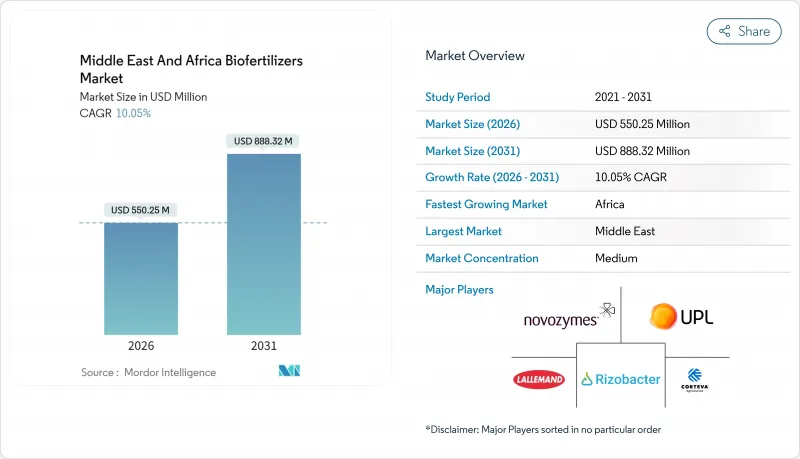
The Middle East and Africa biofertilizers market was valued at USD 500 million in 2025 and estimated to grow from USD 550.25 million in 2026 to reach USD 888.32 million by 2031, at a CAGR of 10.05% during the forecast period (2026-2031).
Momentum stems from region-specific pressures including water scarcity, soil salinity, and synthetic input price volatility, which are accelerating the shift toward biologically based options. Government programs such as Saudi Arabia's Vision 2030, South Africa's regulatory fast-track for biologicals, and the African Union's fertilizer self-sufficiency agenda reinforce adoption by lowering regulatory hurdles and subsidizing biological inputs. Multinational suppliers deepen their presence through local manufacturing and targeted partnerships, while regional innovators secure niches by tailoring microbial strains to harsh agro-climatic conditions. Collectively, these forces position the Middle East and Africa biofertilizers market for robust, policy-backed expansion that aligns with climate-smart agriculture goals.
Middle East And Africa Biofertilizers Market Trends and Insights
Expansion of Organic-Certified Farmland
Certified organic acreage across key Middle East & Africa markets expanded between 2019-2024, with Egypt, Kenya, and South Africa leading adoption rates. This growth trajectory accelerates biofertilizer demand as organic certification standards mandate biological inputs over synthetic alternatives. Kenya's organic sector now encompasses over 165,000 hectares, driven by export market premiums and government support through the National Organic Agriculture Policy. The expansion creates a captive market for biofertilizer suppliers, particularly those offering multi-strain formulations that address the complex nutrient needs of organic production systems. Morocco's Green Morocco Plan has allocated significant resources to organic transition support, creating regulatory frameworks that favor biological inputs and establish quality certification pathways.
Subsidies and Favorable Organic-Input Policies
Government subsidy schemes across the region increasingly favor biological inputs, with Morocco's organic-input subsidy program reducing farmer adoption costs by 25% compared to unsubsidized synthetic alternatives. Saudi Arabia's Ministry of Environment, Water, and Agriculture has implemented targeted support for greenhouse operators adopting biological nutrient management systems, aligning with Vision 2030 sustainability objectives. These policy shifts reflect strategic recognition that biological inputs support food security goals while reducing import dependency. The UAE's National Food Security Strategy 2051 explicitly prioritizes local production technologies, including microbial inoculants for controlled environment agriculture. South Africa's regulatory framework under the Fertilizers, Farm Feeds, Agricultural Remedies and Stock Remedies Act provides clear pathways for biofertilizer registration, though fees ranging from R 3,500 (USD 202.30) for product registration to R 1,800 (USD 104.06) for renewals create cost barriers for smaller manufacturers .
Dominance of Subsidized Synthetic Fertilizers
National fertilizer subsidy programs in Nigeria, Egypt, and other major agricultural economies create structural advantages for synthetic inputs that crowd out biological alternatives in price-sensitive market segments. Nigeria's fertilizer subsidy program, while supporting food security objectives, inadvertently limits biofertilizer adoption by maintaining artificial price advantages for imported synthetic products. Egypt's subsidy framework similarly favors conventional inputs, though recent policy discussions indicate potential inclusion of biological products in future subsidy schemes. These programs create market distortions that require biofertilizer suppliers to compete on performance differentiation rather than cost parity. The fiscal burden of maintaining subsidy programs may create future opportunities for biological inputs as governments seek cost-effective alternatives that support agricultural productivity while reducing budget pressures.
Other drivers and restraints analyzed in the detailed report include:
- Synthetic-Fertilizer Price Volatility
- High-Tech Greenhouse Boom
- Low Farmer Awareness and Weak Extension Networks
For complete list of drivers and restraints, kindly check the Table Of Contents.
Segment Analysis
Rhizobium-based biofertilizers command 35.85% market share in 2025, reflecting the region's substantial legume cultivation for both food security and soil fertility management. This dominance stems from well-established agronomic understanding and proven nitrogen fixation benefits that resonate with cost-conscious farmers.Technology transfer agreements between multinationals and regional labs promote dual branding, enhancing trust among progressive cooperatives. Training modules that bundle Rhizobium use with conservation agriculture practices further anchor repeat sales.
Mycorrhizal products represent the fastest-growing segment at 12.75% CAGR through 2031, driven by adoption in high-value greenhouse operations and drought-prone farming systems where enhanced nutrient uptake provides measurable yield advantages. Research initiatives across the region increasingly focus on indigenous microbial strains adapted to local soil conditions and climatic stresses, potentially reshaping competitive dynamics as locally sourced products gain market acceptance. Companies investing in strain selection and regional adaptation are positioned to capture market share from generic international formulations.
Carrier-enriched biofertilizers maintain 56.80% market share in 2025, reflecting their cost-effectiveness and compatibility with existing farmer application practices across smallholder systems. These formulations utilize locally available carriers such as lignite and charcoal, reducing production costs and supporting regional supply chains. The technology segmentation reflects broader market bifurcation between cost-focused smallholder applications and performance-oriented commercial operations. Companies developing climate-adapted formulations that maintain viability under high-temperature conditions are likely to capture disproportionate value as the market matures and quality standards tighten.
Liquid biofertilizers emerge as the fastest-growing technology segment with 15.1% CAGR through 2031, primarily driven by greenhouse adoption in GCC countries and precision agriculture applications. The liquid segment benefits from superior microbial viability and ease of integration with fertigation systems, though cold-chain requirements limit adoption in infrastructure-constrained markets.
The Middle East and Africa Biofertilizers Market is Segmented by Microorganism Type (Rhizobium, Azotobacter, and More), by Technology Type (Carrier-Enriched Biofertilizers, Liquid Biofertilizers, and More), by Application (Soil Treatment, and More), by Crop Type (Grains and Cereals, and More), and by Geography (Africa, and the Middle East). The Market Forecasts are Provided in Terms of Value (USD) and Volume (Metric Tons).
List of Companies Covered in this Report:
- Novozymes A/S
- UPL Limited
- Lallemand Inc
- Corteva, Inc.
- Rizobacter Argentina S.A.
- FMC Corporation
- Koppert B.V.
- IPL Biologicals Limited
- Groundwork BioAg Ltd.
- Biobest Group NV
- Biomax Technologies Pte. Ltd.
- Mapleton Agri Biotec Pty Ltd
- BASF SE
- Bayer AG
- Corteva Agriscience
Additional Benefits:
- The market estimate (ME) sheet in Excel format
- 3 months of analyst support
TABLE OF CONTENTS
1 Introduction
- 1.1 Study Assumptions and Market Definition
- 1.2 Scope of the Study
2 Research Methodology
3 Executive Summary
4 Market Landscape
- 4.1 Market Overview
- 4.2 Market Drivers
- 4.2.1 Expansion of organic-certified farmland
- 4.2.2 Subsidies and favorable organic-input policies
- 4.2.3 Synthetic-fertilizer price volatility
- 4.2.4 Salinity-mitigation programs in Gulf soils
- 4.2.5 High-tech greenhouse boom
- 4.2.6 Carbon-credit pilots for soil microbiome projects
- 4.3 Market Restraints
- 4.3.1 Dominance of subsidized synthetic fertilizers
- 4.3.2 Low farmer awareness and weak extension networks
- 4.3.3 Counterfeit / low-quality inoculants from regulatory gaps
- 4.3.4 Cold-chain logistics hurdles for liquid formulations
- 4.4 Regulatory Landscape
- 4.5 Technological Outlook
- 4.6 Porter's Five Forces Analysis
- 4.6.1 Threat of New Entrants
- 4.6.2 Bargaining Power of Buyers
- 4.6.3 Bargaining Power of Suppliers
- 4.6.4 Threat of Substitutes
- 4.6.5 Competitive Rivalry
5 Market Size and Growth Forecasts (Value and Volume)
- 5.1 By Microorganism Type
- 5.1.1 Rhizobium
- 5.1.2 Azotobacter
- 5.1.3 Azospirillum
- 5.1.4 Phosphate-solubilizing Bacteria
- 5.1.5 Mycorrhiza
- 5.1.6 Other Microorganisms
- 5.2 By Technology Type
- 5.2.1 Carrier-enriched Biofertilizers
- 5.2.2 Liquid Biofertilizers
- 5.2.3 Encapsulated / Bead Technology
- 5.2.4 Other Technologies
- 5.3 By Application
- 5.3.1 Soil Treatment
- 5.3.2 Seed Treatment
- 5.3.3 Foliar / Root Dipping
- 5.3.4 Other Applications
- 5.4 By Crop Type
- 5.4.1 Grains
- 5.4.2 Pulses
- 5.4.3 Commercial Crops
- 5.4.4 Fruits and Vegetables
- 5.4.5 Other Crops
- 5.5 By Geography
- 5.5.1 Africa
- 5.5.1.1 South Africa
- 5.5.1.2 Kenya
- 5.5.1.3 Uganda
- 5.5.1.4 Tanzania
- 5.5.1.5 Nigeria
- 5.5.1.6 Rest of Africa
- 5.5.2 Middle East
- 5.5.2.1 United Arab Emirates
- 5.5.2.2 Saudi Arabia
- 5.5.2.3 Turkey
- 5.5.2.4 Egypt
- 5.5.2.5 Qatar
- 5.5.2.6 Rest of Middle East
- 5.5.1 Africa
6 Competitive Landscape
- 6.1 Market Concentration
- 6.2 Strategic Moves
- 6.3 Market Share Analysis
- 6.4 Company Profiles (Includes Global Level Overview, Market Level Overview, Core Segments, Financials as Available, Strategic Information, Market Rank/Share, Products and Services, Recent Developments)
- 6.4.1 Novozymes A/S
- 6.4.2 UPL Limited
- 6.4.3 Lallemand Inc
- 6.4.4 Corteva, Inc.
- 6.4.5 Rizobacter Argentina S.A.
- 6.4.6 FMC Corporation
- 6.4.7 Koppert B.V.
- 6.4.8 IPL Biologicals Limited
- 6.4.9 Groundwork BioAg Ltd.
- 6.4.10 Biobest Group NV
- 6.4.11 Biomax Technologies Pte. Ltd.
- 6.4.12 Mapleton Agri Biotec Pty Ltd
- 6.4.13 BASF SE
- 6.4.14 Bayer AG
- 6.4.15 Corteva Agriscience
7 Market Opportunities and Future Outlook

