
PUBLISHER: Mordor Intelligence | PRODUCT CODE: 1906207

PUBLISHER: Mordor Intelligence | PRODUCT CODE: 1906207
Pizza Foodservice - Market Share Analysis, Industry Trends & Statistics, Growth Forecasts (2026 - 2031)
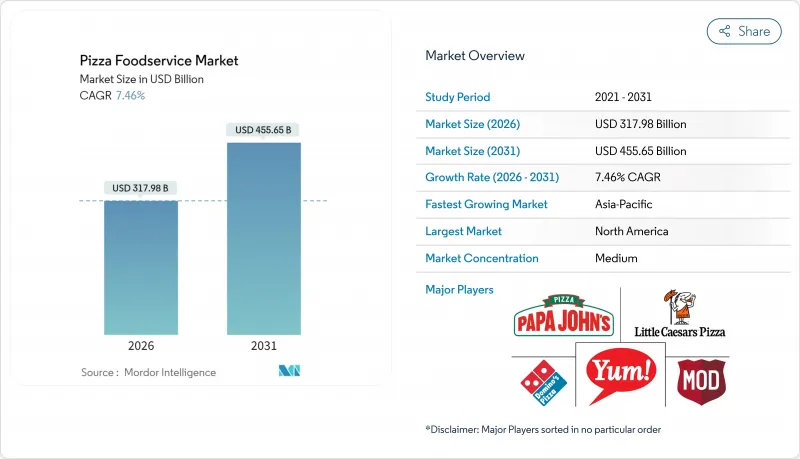
pizza foodservice market size in 2026 is estimated at USD 317.98 billion, growing from 2025 value of USD 295.92 billion with 2031 projections showing USD 455.65 billion, growing at 7.46% CAGR over 2026-2031.
The global surge is fueled by an increasing appetite for on-the-go meals, swift menu tweaks, and engaging dining experiences. Data from the U.S. Securities and Exchange Commission reveals that in 2024, U.S. consumers shelled out approximately USD 42.1 billion at quick-service pizza joints, up nearly two percent from the USD 41.3 billion spent the year prior. Technological advancements, from automated make-lines to savvy demand forecasting, are lightening labor demands and boosting efficiency. Operators are also embracing sustainable delivery methods, think electric two-wheeler fleets and eco-friendly packaging, not just for cost savings but to build consumer trust. Flavor innovation is key, with fusion toppings appealing to a broader audience and justifying premium pricing.
Global Pizza Foodservice Market Trends and Insights
Global Fusion Pizza Flavors
U.S. consumers are increasingly gravitating towards international flavors, reshaping pizza menus across the nation. Data from the U.S. Securities and Exchange Commission reveals that U.S. consumers spent about USD 16.9 billion on pizza deliveries in 2024, marking a modest rise from the USD 16.5 billion spent the year prior. While traditional Italian pizzas laid the groundwork, the menu now boasts an array of influences, from Mexican and Greek to Korean, Indian, and other regional fusions, all tailored to local palates yet retaining a global allure. As the market saturates, the rise of fusion flavors offers chains and independent pizzerias a chance to stand out. Capitalizing on this trend, pizza chains are not only justifying premium prices but also attracting a broader audience, including those who once found pizza offerings repetitive. Moreover, the growing popularity of these fusion flavors aligns seamlessly with the culinary tourism boom, as diners increasingly seek genuine international culinary experiences.
Robot-Driven and Automated Kitchen Operations
Capriotti's Sandwich Shop has teamed up with Piestro to roll out automated pizza kiosks, capable of crafting, slicing, and boxing pizzas in just 3 minutes. Over the next five years, Capriotti's aims to acquire up to 100 of these kiosks, focusing on boosting dinner service and maximizing revenue during typically slower hours. This move not only tackles pressing labor shortages but also enhances consistency and trims operational costs, a boon given the rising minimum wages in key markets. Similarly, in June 2025, Donatos Pizza launched its fully autonomous pizza restaurant. HMS Host operates the restaurant and will operate 24/7, leveraging state-of-the-art robotics and data science technologies, enabling an efficient experience for customers on everything from placing orders to receiving their pizza. Furthermore, the technology paves the way for pizza sales in unconventional spots and allows for extended service hours without a corresponding spike in labor costs. Yet, the significant capital and maintenance demands indicate that initially, only larger operators with the scale to absorb these investments will lead the charge in adoption.
Ingredient Cost Volatility
Key ingredients in pizza-making, such as tomatoes and olive oil, have seen dramatic price hikes over the past four years, reshaping the economics of the beloved dish. In 2024, the Bureau of Labor Statistics reported that the retail price of field-grown tomatoes in the U.S. climbed to USD 2.07 per pound, up from USD 1.99 the year prior. Meanwhile, ISMEA Istituto di Servizi per il Mercato Agricolo Alimentare noted that olive oil prices in Italy surged over 34% in the last quarter of 2023 compared to the previous quarter. Labor costs further complicate the scenario. New York's minimum wage has jumped from USD 7.15 in 2007 to a staggering USD 16 in 2024. This has compelled operators to adjust their pricing strategies, albeit at the risk of losing customers. As a result, restaurant menu prices have risen in 2024, amplifying the cost disparity between dining out and cooking at home. Such inflationary pressures have even led to the disappearance of iconic offerings, like New York's famed USD 1 pizza slice. While operators are adapting through menu engineering, portion optimization, and diversifying their supply chains, the persistent inflation poses a looming threat to profitability across the board.
Other drivers and restraints analyzed in the detailed report include:
- Plant-Based and Functional Ingredients
- Sustainable Operations and Green Delivery
- Brand Fatigue and Menu Saturation
For complete list of drivers and restraints, kindly check the Table Of Contents.
Segment Analysis
In 2025, chained outlets held a dominant 69.62% market share, capitalizing on standardized operations, efficient supply chains, and strong brand recognition, allowing them to scale swiftly across varied markets. Yet, independent outlets are on an upward trajectory, boasting an impressive 8.26% CAGR growth rate projected through 2031. This surge is fueled by a consumer preference for authentic, locally-sourced experiences, something chains find challenging to emulate. This divide mirrors broader market trends, pitting the advantages of scale against the allure of personalization and community ties. While independent operators harness social media and local collaborations to cultivate loyal clientele, chains are channeling investments into technology and automation to uphold their cost edge.
Franchise models are adapting to navigate this landscape. &pizza, for instance, is eyeing a bold expansion with plans for 250-300 new stores by 2030, predominantly through 80-90% franchised operations. This strategy melds brand power with local stewardship. Such a franchise model not only accelerates growth but also ensures a pulse on local market nuances, albeit with a need for robust support systems to uphold quality. The market is witnessing heightened consolidation, exemplified by acquisitions like 1000 Degrees' takeover of My Pie, aimed at harnessing operational synergies and broadening market reach. These evolving dynamics hint at a market split: one side leans towards large-scale efficiency, while the other champions hyper-local distinction, leaving mid-sized players at a crossroads, grappling with strategic choices.
In 2025, carry-out and take-away operations claimed a dominant 46.85% market share, underscoring a consumer preference for convenience and value that remains steadfast, even amidst economic fluctuations. While dine-in services cater to specific occasions and demographics, delivery-only ghost kitchens are set to expand at a 8.74% CAGR, defying industry-wide challenges that have dampened earlier forecasts. Despite facing setbacks as diners gravitated back to traditional restaurants post-pandemic, ghost kitchens are adapting, with many operators diversifying into catering and event services to broaden their revenue streams beyond mere delivery.
This evolution in service models underscores a deeper shift in consumer behavior and operational economics, rather than just fleeting preferences. Take Domino's, for instance: their foray into third-party delivery partnerships, which accounted for 3% of U.S. sales in 2024, highlights how legacy chains are embracing aggregator platforms, all while nurturing direct ties with customers. This balanced strategy not only paves the way for market growth but also safeguards existing channels, albeit with a need for meticulous margin oversight and brand stewardship. As operators recalibrate their focus from mere growth to profitability, the segmentation of service models is poised for further evolution, with the most successful ones showcasing robust unit economics and efficient customer acquisition strategies.
The Pizza Foodservice Market is Segmented by Structure (Chained Outlets and Independent Outlets), Service Model (Delivery-Only (Ghost Kitchens), Dine-In, and Carry-Out/Take-Away), Restaurant Format (Quick-Service (QSR), Fast-Casual, and Full-Service/Casual Dining), Location (Leisure, Lodging, Retail, Standalone, and Travel), and Geography. The Market Forecasts are Provided in Terms of Value (USD).
Geography Analysis
In 2025, North America held a dominant 39.18% share of the pizza foodservice market, bolstered by robust delivery networks, deep customer loyalty, and a well-established cold-chain infrastructure. Recent relaxations by the USDA on pizza standards now empower operators to experiment with toppings beyond the traditional tomato and cheese, hastening the pace of recipe innovation. However, with ingredient costs rising and labor markets tightening, safeguarding profit margins has become a challenge, prompting increased investments in kitchen robotics and dynamic pricing strategies.
Asia-Pacific, projected to grow at a robust 8.21% CAGR, emerges as the region to watch. In the first half of 2024, one prominent chain in China reported a staggering 48.3% year-on-year revenue surge, bolstered by ambitions to expand its footprint to over 600 stores by 2026. Western fast-food brands are making significant inroads, with sales hitting 268 billion yuan in 2023 and 80% of these brands boasting more than 10 outlets. Notably, localization strategies, like offering seafood toppings in coastal regions or crafting lower-cheese pies for lactose-sensitive consumers, are proving essential.
Europe's pizza market is witnessing steady growth, albeit at a modest pace, driven by trends of premiumization and sustainability. The UK's pizza sector neared annual sales of GBP 1.8 billion, thanks in part to the popularity of at-home "fakeaway" kits that meld the convenience of takeout with the joy of cooking. Meanwhile, South America and the Middle East and Africa are experiencing bursts of momentum, often linked to urban expansion and increasing disposable incomes. Highlighting the significance of partnerships in global expansions, a South Korean mini-pie brand, under the aegis of a Thai conglomerate, boasts 450 outlets across seven nations and has set its sights on 1,200 by year's end.
- Domino's Pizza Inc.
- Yum! Brands (Pizza Hut)
- Papa John's International
- Little Caesars (Ilitch Holdings)
- California Pizza Kitchen
- Marco's Franchising
- Darden Restaurants (Olive Garden and Specialty Brands)
- MTY Food Group
- Retail Food Group
- Uno Restaurant Holdings
- MOD Pizza
- Blaze Pizza
- Sbarro LLC
- Jet's Pizza
- Hungry Howie's Pizza
- PizzaExpress (Grupo BCP)
- Telepizza Group
- CEC Entertainment (Chuck E. Cheese)
- Papa Murphy's Holdings
- Lou Malnati's Pizzeria
Additional Benefits:
- The market estimate (ME) sheet in Excel format
- 3 months of analyst support
TABLE OF CONTENTS
1 INTRODUCTION
- 1.1 Study Assumptions and Market Definition
- 1.2 Scope of the Study
2 RESEARCH METHODOLOGY
3 EXECUTIVE SUMMARY
4 MARKET LANDSCAPE
- 4.1 Market Overview
- 4.2 Market Drivers
- 4.2.1 Global Fusion Pizza Flavors
- 4.2.2 Robot-Driven and Automated Kitchen Operations
- 4.2.3 Plant-Based and Functional Ingredients
- 4.2.4 Augmented Reality (AR) and Interactive Packaging
- 4.2.5 Sustainable Operations and Green Delivery
- 4.2.6 Indulgent Dessert and Functional Pizzas
- 4.3 Market Restraints
- 4.3.1 Ingredient Cost Volatility
- 4.3.2 Substitute Product Competition
- 4.3.3 Quality Consistency Across Locations
- 4.3.4 Brand Fatigue and Menu Saturation
- 4.4 Supply-Chain Analysis
- 4.5 Regulatory Landscape
- 4.6 Technological Outlook
- 4.7 Porter's Five Forces
- 4.7.1 Threat of New Entrants
- 4.7.2 Bargaining Power of Buyers
- 4.7.3 Bargaining Power of Suppliers
- 4.7.4 Threat of Substitutes
- 4.7.5 Competitive Rivalry
5 MARKET SIZE AND GROWTH FORECASTS (VALUE)
- 5.1 By Structure
- 5.1.1 Chained Outlets
- 5.1.2 Independent Outlets
- 5.2 By Service Model
- 5.2.1 Delivery-only (Ghost Kitchens)
- 5.2.2 Dine-in
- 5.2.3 Carry-out/Take-away
- 5.3 By Restaurant Format
- 5.3.1 Quick-Service (QSR)
- 5.3.2 Fast-Casual
- 5.3.3 Full-Service/Casual Dining
- 5.4 By Location
- 5.4.1 Leisure
- 5.4.2 Lodging
- 5.4.3 Retail
- 5.4.4 Standalone
- 5.4.5 Travel
- 5.5 By Geography
- 5.5.1 North America
- 5.5.1.1 United States
- 5.5.1.2 Canada
- 5.5.1.3 Mexico
- 5.5.1.4 Rest of North America
- 5.5.2 South America
- 5.5.2.1 Brazil
- 5.5.2.2 Argentina
- 5.5.2.3 Colombia
- 5.5.2.4 Chile
- 5.5.2.5 Rest of South America
- 5.5.3 Europe
- 5.5.3.1 United Kingdom
- 5.5.3.2 Germany
- 5.5.3.3 France
- 5.5.3.4 Italy
- 5.5.3.5 Spain
- 5.5.3.6 Russia
- 5.5.3.7 Sweden
- 5.5.3.8 Belgium
- 5.5.3.9 Poland
- 5.5.3.10 Netherlands
- 5.5.3.11 Rest of Europe
- 5.5.4 Asia-Pacific
- 5.5.4.1 China
- 5.5.4.2 Japan
- 5.5.4.3 India
- 5.5.4.4 Thailand
- 5.5.4.5 Singapore
- 5.5.4.6 Indonesia
- 5.5.4.7 South Korea
- 5.5.4.8 Australia
- 5.5.4.9 New Zealand
- 5.5.4.10 Rest of Asia Pacific
- 5.5.5 Middle East and Africa
- 5.5.5.1 United Arab Emirates
- 5.5.5.2 South Africa
- 5.5.5.3 Saudi Arabia
- 5.5.5.4 Nigeria
- 5.5.5.5 Egypt
- 5.5.5.6 Morocco
- 5.5.5.7 Turkey
- 5.5.5.8 Rest of Middle East and Africa
- 5.5.1 North America
6 COMPETITIVE LANDSCAPE
- 6.1 Market Concentration
- 6.2 Strategic Moves
- 6.3 Market Share Analysis
- 6.4 Company Profiles (includes Global level Overview, Market level overview, Core Segments, Financials as available, Strategic Information, Market Rank/Share for key companies, Products and Services, and Recent Developments)
- 6.4.1 Domino's Pizza Inc.
- 6.4.2 Yum! Brands (Pizza Hut)
- 6.4.3 Papa John's International
- 6.4.4 Little Caesars (Ilitch Holdings)
- 6.4.5 California Pizza Kitchen
- 6.4.6 Marco's Franchising
- 6.4.7 Darden Restaurants (Olive Garden and Specialty Brands)
- 6.4.8 MTY Food Group
- 6.4.9 Retail Food Group
- 6.4.10 Uno Restaurant Holdings
- 6.4.11 MOD Pizza
- 6.4.12 Blaze Pizza
- 6.4.13 Sbarro LLC
- 6.4.14 Jet's Pizza
- 6.4.15 Hungry Howie's Pizza
- 6.4.16 PizzaExpress (Grupo BCP)
- 6.4.17 Telepizza Group
- 6.4.18 CEC Entertainment (Chuck E. Cheese)
- 6.4.19 Papa Murphy's Holdings
- 6.4.20 Lou Malnati's Pizzeria
7 MARKET OPPORTUNITIES AND FUTURE OUTLOOK

