
PUBLISHER: Mordor Intelligence | PRODUCT CODE: 1906911

PUBLISHER: Mordor Intelligence | PRODUCT CODE: 1906911
Japan Kitchen Appliances - Market Share Analysis, Industry Trends & Statistics, Growth Forecasts (2026 - 2031)
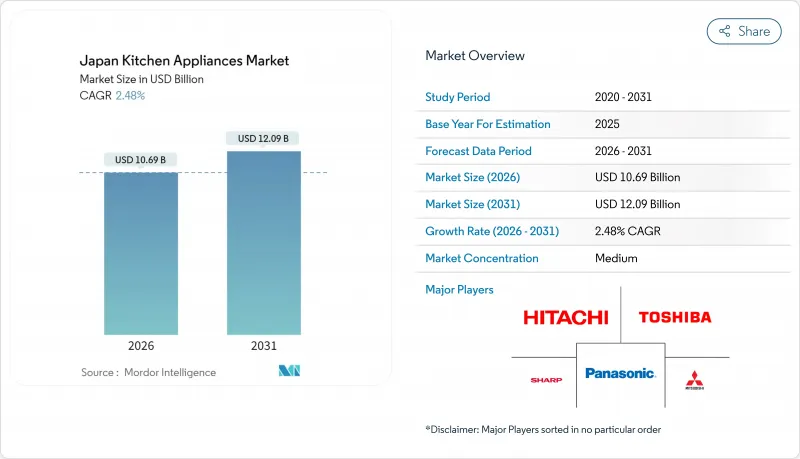
The Japan kitchen appliances market was valued at USD 10.43 billion in 2025 and estimated to grow from USD 10.69 billion in 2026 to reach USD 12.09 billion by 2031, at a CAGR of 2.48% during the forecast period (2026-2031).
The market's steady trajectory balances demographic headwinds against technology-led premiumization, stricter Top Runner energy standards, and widespread e-commerce adoption. Health-oriented cooking trends, rising single-person households, and greater acceptance of compact multi-function devices reinforce demand even as overall household formation moderates. Manufacturers defend margins by embedding AI, voice control, and energy-monitoring features that resonate with older consumers and sustainability-focused buyers. Government rebate programs and corporate decarbonization targets further incentivize upgrades to high-efficiency models, anchoring the long-term resilience of the Japan kitchen appliances market
Japan Kitchen Appliances Market Trends and Insights
Energy-efficient appliance rebates and Top Runner standards extension to 2030
Japan's decision to prolong Top Runner efficiency rules until 2030 forces every manufacturer to benchmark future models against today's best-in-class performer rather than a static minimum. Panasonic showcased the competitive stakes when its AI rice cooker automatically optimized heat curves to curb power use while preserving flavor. Nationwide rebates delivered through the Sustainable Open Innovation Initiative reimburse up to 50% of incremental costs on registered high-efficiency units, accelerating payback periods for households and small businesses. Consumer testing by the Agency for Natural Resources and Energy found that pairing energy-cost labels with convenience messaging boosted the selection of compliant appliances by 74.2%. Together, performance-based regulation and targeted subsidies raise the baseline for product development and stimulate replacement demand, underpinning incremental gains in the Japanese kitchen appliance market adoption.
Rapid growth of e-commerce and last-mile delivery services for bulky goods
Home-appliance e-commerce penetration reached 42.88%, the second-highest of any retail category, equating to JPY 2.68 trillion in sales during 2024. Retailers such as Japanet Takata simplified trade-in, delivery, and installation in a single appointment, attracting 18.35 million users and demonstrating how service integration offsets the physical complexity of shipping large items. Greater logistics density and tighter time-slot guarantees reduce consumer anxiety over failed deliveries and damage, supporting premium online purchases that once required in-store evaluation. Manufacturers respond by furnishing AR product visualizers and live-streamed demonstrations to replicate hands-on assessment. As omnichannel ecosystems mature, the Japan kitchen appliances market derives incremental volume from both digital natives and aging consumers who value door-to-door convenience.
Shrinking household size lowering replacement volumes for large appliances
Average household size slipped to 2.21 members in 2024, with single-person homes making up 38.1% of the total. Smaller families operate refrigerators and dishwashers less intensively, lengthening replacement cycles beyond the historical 10- to 12-year norm. Rural depopulation intensifies the effect, where entire municipalities shrink, eroding aggregate demand. Manufacturers cushion volume declines by offering refurbishment programs that refurbish returned units under warranty and sell them through outlet channels at moderate premiums. Extended warranties and subscription-based filter replacements further monetize the installed base without relying on rapid turnover.
Other drivers and restraints analyzed in the detailed report include:
- Aging-in-place renovations driving demand for ergonomic, voice-controlled appliances
- Urban micro-kitchen trend spurring compact multi-function devices
- Supply-chain exposure to Chinese component makers causing lead-time volatility
For complete list of drivers and restraints, kindly check the Table Of Contents.
Segment Analysis
Refrigerators and freezers held 28.97% of Japan kitchen appliances market share in 2025, underscoring their indispensable status in every home. Air fryers, forecast to grow at an 10.73% CAGR, exemplify how health-oriented, space-conscious households drive compact innovation. Induction cooktops gain traction because they align with smart energy platforms, while large dishwashers lag due to installation limits in aging apartments. Coffee makers, electric kettles, and AI rice cookers keep momentum by serving hybrid workers seeking convenience upgrades. Brand rivalry now pivots on voice control, recipe apps, and energy dashboards rather than aggressive discounting. Premium compact devices, therefore, offset slower large-appliance replacement, sustaining overall Japan kitchen appliances market resilience.
The Japan Kitchen Appliances Market Report is Segmented by Product (Large Kitchen Appliances: Refrigerators & Freezers, Dishwashers and More Small Kitchen Appliances: Food Processors, Juicers and Blender and More) by End User (Residential, Commercial), by Distribution Channel ( Multi-Brand Stores, Exclusive Brand Outlets and More) by Geography (Kanto, Kansai, Chubu and More). The Market Forecasts are Provided in Terms of Value
List of Companies Covered in this Report:
- Panasonic Corporation
- Sharp Corporation
- Hitachi Global Life Solutions
- Mitsubishi Electric Corporation
- Toshiba Lifestyle Products & Services
- Zojirushi Corporation
- Tiger Corporation
- Rinnai Corporation
- Paloma Industries
- Noritz Corporation
- LIXIL Corporation
- Cleanup Corporation
- Takara Standard Co., Ltd.
- Haier Japan Holdings
- LG Electronics Japan
- Samsung Electronics Japan
- Groupe SEB (T-fal Japan)
- Koninklijke Philips N.V. (Philips Japan)
- SharkNinja (Ninja Japan)
- De'Longhi Japan
- Midea Group (Japan)
Additional Benefits:
- The market estimate (ME) sheet in Excel format
- 3 months of analyst support
TABLE OF CONTENTS
1 Introduction
2 Research Methodology
3 Executive Summary
4 Market Landscape
- 4.1 Market Overview
- 4.2 Market Drivers
- 4.2.1 Energy-efficient appliance rebates and Top Runner standards extension to 2030
- 4.2.2 Rapid growth of e-commerce and last-mile delivery services for bulky goods
- 4.2.3 Aging-in-place renovations driving demand for ergonomic, voice-controlled appliances
- 4.2.4 Urban micro-kitchen trend spurring compact multi-function devices
- 4.2.5 Corporate decarbonization targets boosting demand for smart energy-monitoring white goods
- 4.2.6 Build-to-rent housing boom accelerating large bulk orders for standardised built-in suites
- 4.3 Market Restraints
- 4.3.1 Shrinking household size lowering replacement volumes for large appliances
- 4.3.2 Supply-chain exposure to Chinese component makers causing lead-time volatility
- 4.3.3 Slow real-income growth limiting adoption of premium smart appliances
- 4.3.4 E-waste regulations raising reverse-logistics and recycling costs
- 4.4 Value / Supply-Chain Analysis
- 4.5 Regulatory Landscape
- 4.6 Technological Outlook
- 4.7 Porter's Five Forces
- 4.7.1 Threat of New Entrants
- 4.7.2 Bargaining Power of Suppliers
- 4.7.3 Bargaining Power of Buyers
- 4.7.4 Threat of Substitutes
- 4.7.5 Competitive Rivalry
5 Market Size & Growth Forecasts
- 5.1 By Product
- 5.1.1 Large Kitchen Appliances
- 5.1.1.1 Refrigerators & Freezers
- 5.1.1.2 Dishwashers
- 5.1.1.3 Range Hoods
- 5.1.1.4 Cooktops
- 5.1.1.5 Ovens
- 5.1.1.6 Other Large Kitchen Appliances
- 5.1.2 Small Kitchen Appliances
- 5.1.2.1 Food Processors
- 5.1.2.2 Juicers and Blenders
- 5.1.2.3 Grills and Roasters
- 5.1.2.4 Air Fryers
- 5.1.2.5 Coffee Makers
- 5.1.2.6 Electric Cookers
- 5.1.2.7 Toasters
- 5.1.2.8 Electric Kettles
- 5.1.2.9 Counter-top Ovens
- 5.1.2.10 Other Small Kitchen Appliances
- 5.1.1 Large Kitchen Appliances
- 5.2 By End User
- 5.2.1 Residential
- 5.2.2 Commercial
- 5.3 By Distribution Channel
- 5.3.1 B2C / Retail
- 5.3.1.1 Multi-brand Stores
- 5.3.1.2 Exclusive Brand Outlets
- 5.3.1.3 Online
- 5.3.1.4 Other Distribution Channels
- 5.3.2 B2B (Direct from Manufacturers)
- 5.3.1 B2C / Retail
- 5.4 By Geography
- 5.4.1 Kanto
- 5.4.2 Kansai
- 5.4.3 Chubu
- 5.4.4 Kyushu
- 5.4.5 Hokkaido
- 5.4.6 Tohoku
- 5.4.7 Chugoku
- 5.4.8 Shikoku
- 5.4.9 Okinawa
6 Competitive Landscape
- 6.1 Market Concentration
- 6.2 Strategic Moves
- 6.3 Market Share Analysis
- 6.4 Company Profiles (includes Global level Overview, Market level overview, Core Segments, Financials as available, Strategic Information, Market Rank/Share for key companies, Products & Services, and Recent Developments)
- 6.4.1 Panasonic Corporation
- 6.4.2 Sharp Corporation
- 6.4.3 Hitachi Global Life Solutions
- 6.4.4 Mitsubishi Electric Corporation
- 6.4.5 Toshiba Lifestyle Products & Services
- 6.4.6 Zojirushi Corporation
- 6.4.7 Tiger Corporation
- 6.4.8 Rinnai Corporation
- 6.4.9 Paloma Industries
- 6.4.10 Noritz Corporation
- 6.4.11 LIXIL Corporation
- 6.4.12 Cleanup Corporation
- 6.4.13 Takara Standard Co., Ltd.
- 6.4.14 Haier Japan Holdings
- 6.4.15 LG Electronics Japan
- 6.4.16 Samsung Electronics Japan
- 6.4.17 Groupe SEB (T-fal Japan)
- 6.4.18 Koninklijke Philips N.V. (Philips Japan)
- 6.4.19 SharkNinja (Ninja Japan)
- 6.4.20 De'Longhi Japan
- 6.4.21 Midea Group (Japan)
7 Market Opportunities & Future Outlook
- 7.1 Integration of domestic IoT platforms with municipal smart-home subsidy programs
- 7.2 Circular-economy appliance leasing models tailored to Japan's ageing population

