
PUBLISHER: Mordor Intelligence | PRODUCT CODE: 1906947

PUBLISHER: Mordor Intelligence | PRODUCT CODE: 1906947
North America Data Center Power - Market Share Analysis, Industry Trends & Statistics, Growth Forecasts (2026 - 2031)
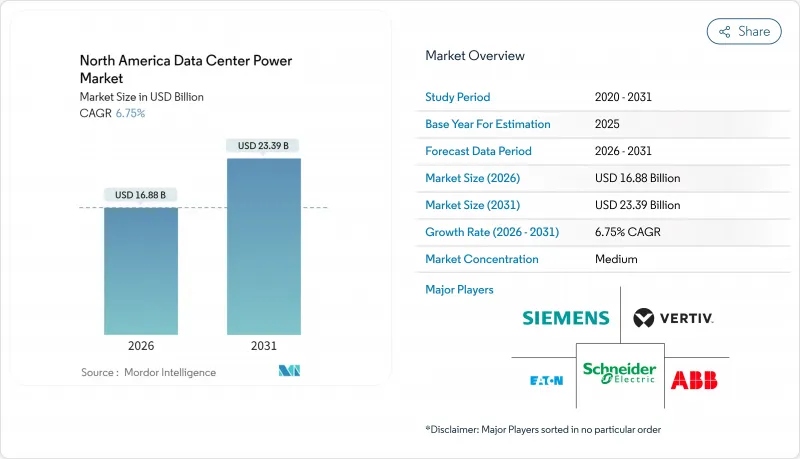
The North America data center power market size in 2026 is estimated at USD 16.88 billion, growing from 2025 value of USD 15.81 billion with 2031 projections showing USD 23.39 billion, growing at 6.75% CAGR over 2026-2031.
Solid growth is tied to AI-centric workloads that push rack densities from 5-15 kW to 40-140 kW, forcing operators to modernize electrical architectures. Hyperscale campuses anchor demand as they build gigawatt-scale substations, while edge computing rolls out micro sites that need autonomous UPS and generator sets. Stricter efficiency regulations such as PUE thresholds are accelerating liquid-cooling adoption and battery-energy-storage integration. Renewable power purchase agreements (PPAs) signed in Texas, Quebec, and Alberta have become a hedge against volatile utility tariffs while meeting corporate sustainability goals. Heightened grid-capacity constraints in tier-1 metros now shift expansion toward secondary U.S. markets, hydro-rich Canadian provinces, and Mexico's emerging colocation hubs.
North America Data Center Power Market Trends and Insights
Rising Adoption of Hyperscale and Mega Data Centers
Hyperscale operators now plan multi-building campuses that draw hundreds of megawatts from on-site substations and deploy liquid-cooled GPU racks requiring continuous, high-quality power. Meta's USD 65 billion program targets sub-1.1 PUE across North American sites, underscoring how power design has become a cornerstone of sustainability commitments.Projects such as Alberta's Wonder Valley park pair natural-gas turbines with geothermal loops to create 1.4 GW of dedicated capacity, illustrating a shift toward self-generation when grid queues exceed four years. The clustering of campuses around cheap renewable resources generates regional load pockets that utilities must accommodate through accelerated transmission upgrades. Vendors that deliver factory-integrated switchgear, busways, and energy-storage modules win share by shortening electrification timelines and reducing site labor. The scale of investment also drives adoption of software-defined power monitoring that optimizes load placement and sequence-starts generators to prevent grid flicker.
Surge in Cloud Computing and OTT Traffic
Rapid growth in collaboration tools, streaming media, and generative AI inference pushes carriers and cloud providers to place compute closer to end users. Edge nodes ranging from 250 kW to 1 MW are now installed in retail strips, telco hubs, and municipal shelters, each fitted with lithium-ion UPS, compact gensets, and remote-management firmware. Distributed sites complicate capacity planning because utility feeders vary widely in voltage stability and outage frequency. Operators mitigate risk with dual-feed automatic transfer switches and cloud-based SCADA dashboards that aggregate alarms across hundreds of micro facilities. Content delivery acceleration also demands higher burst power to cover codec transcoding spikes, prompting adoption of static-switch UPS topologies that deliver millisecond transfer times. The cumulative effect of thousands of edge sites lifts overall regional load, yet each location must comply with state energy codes that increasingly cap allowable PUE thresholds.
High Upfront CAPEX for Power & Cooling Retrofits
Many brownfield data centers were designed for 5-15 kW racks and must be gutted to accommodate 40-140 kW AI loads. Electrical rooms often need transformer upsizing, busway rerouting, and replacement of air-cooled CRAC units with liquid chillers, driving project costs above new-build benchmarks. Operators must stage construction around live workloads, lengthening schedules and elevating risk. Smaller providers struggle to secure financing for large-scale electrical upgrades without anchor customers or government incentives. Even where funding is available, supply-chain lead times for 24-kV switchgear and 3 MVA UPS frames can exceed 60 weeks. The immediate cash outlay thus curbs near-term market penetration of AI-optimized power solutions.
Other drivers and restraints analyzed in the detailed report include:
- Stringent PUE / Energy-Efficiency Mandates
- Colocation Demand from BFSI and Healthcare Digitalization
- Grid-Capacity Bottlenecks in Tier-1 Metros
For complete list of drivers and restraints, kindly check the Table Of Contents.
Segment Analysis
The segment holding 44.40% of 2025 revenue remains power-distribution solutions-switchgear, PDU, and busway-that form the electrical backbone of every facility. However, services are expanding at a 6.98% CAGR because owners need design, integration, and predictive-maintenance expertise. Consulting engagements now begin months before ground-break, covering harmonic analysis, short-circuit studies, and energy-storage ROI modeling. Integration specialists engineer "single-line-diagram" conformity across multi-phase build-outs to avoid stranded capacity. Support teams embed edge analytics in UPS modules, generating data that auto-creates work orders before SLA breaches. Those value-added services raise stickiness, turning hardware suppliers into long-term partners.
Vendors bundle firmware upgrades that enable advanced runtime calculations, extending battery life and cutting replace-ment cycles. Where labor availability is tight, remote-hands contracts cover IR scanning, breaker racking, and thermal runway avoidance. The North America data center power market benefits because service annuities smooth revenue between mega-project cycles, incentivizing firms to maintain large regional field forces that in turn reassure hyperscale clients of rapid response times.
Hyperscale campuses held 47.55% share in 2025, reflecting their sheer size and standardized power blocks. Yet edge and micro data centers deliver the fastest 6.92% CAGR as AI inference shifts compute toward consumers. These pods rely on 208/415 V distribution with high-efficiency line-interactive UPS to minimize footprint, contrasting with 13.8 kV feeders and double-conversion UPS found in hyperscale builds. The North America data center power market size for edge form factors thus grows on a unit-count basis rather than megawatt alone.
In parallel, enterprise facilities embrace hybrid models, expanding electrical capacity to host private-cloud clusters while off-loading latency-sensitive tasks to nearby edge nodes. Operators adopt modular battery cabinets that scale in 100 kW increments, matching phased IT expansions. Hyperscale builders experiment with direct renewable feeders combined with short-duration flywheel UPS to shave opex. The convergence of design philosophies drives suppliers to offer "families" of switchgear and UPS that share firmware and monitoring APIs, cutting integration costs across facility classes.
The North America Data Center Power Market Report is Segmented by Type (Solution, and Service), Data Center Type (Colocation, Hyperscale, and More), End-User Industry (BFSI, IT and Telecom, and More), Power Capacity (<= 500 KW, Greater Than 3 MW, and More), Tier Standard (Tier I and II, Tier IV, and More), and Geography (United States, Canada and More). Market Forecasts are Provided in Terms of Value (USD).
List of Companies Covered in this Report:
- ABB Ltd
- Schneider Electric
- Vertiv Group Corp.
- Eaton Corp. (incl. Tripp Lite)
- Legrand (Raritan, Starline)
- nVent (Enlogic)
- Siemens AG
- Cummins Inc.
- Caterpillar Inc.
- Generac Power Systems
- Mitsubishi Electric
- Delta Electronics
- Huawei Technologies Co. Ltd.
- Piller Power Systems
- Kohler Co.
- LayerZero Power Systems
- Socomec Group
- Panduit Corp.
- Riello UPS
- Power Innovations International
- Starline (Legrand)
- Powin Energy
- Bloom Energy
Additional Benefits:
- The market estimate (ME) sheet in Excel format
- 3 months of analyst support
TABLE OF CONTENTS
1 INTRODUCTION
- 1.1 Study Assumptions and Market Definition
- 1.2 Scope of the Study
2 RESEARCH METHODOLOGY
3 EXECUTIVE SUMMARY
4 MARKET LANDSCAPE
- 4.1 Market Overview
- 4.2 Market Drivers
- 4.2.1 Rising adoption of hyperscale and mega data centers
- 4.2.2 Surge in cloud computing and OTT traffic
- 4.2.3 Stringent PUE / energy-efficiency mandates
- 4.2.4 Colocation demand from BFSI and healthcare digitalization
- 4.2.5 Utility-scale renewable PPAs stabilising power costs
- 4.2.6 Edge-AI micro DC rollout in rural and suburban clusters
- 4.3 Market Restraints
- 4.3.1 High upfront CAPEX for power and cooling retrofits
- 4.3.2 Grid-capacity bottlenecks in Tier-1 metros
- 4.3.3 Shortage of certified high-voltage technicians
- 4.3.4 Water-based cooling's hidden power penalty scrutiny
- 4.4 Value / Supply-Chain Analysis
- 4.5 Regulatory Landscape
- 4.6 Technological Outlook
- 4.7 Porter's Five Forces
- 4.7.1 Bargaining Power of Suppliers
- 4.7.2 Bargaining Power of Buyers
- 4.7.3 Threat of New Entrants
- 4.7.4 Threat of Substitutes
- 4.7.5 Intensity of Competitive Rivalry
- 4.8 Geopolitical Impact on DC Infrastructure
- 4.9 Industry Ecosystem Analysis
5 ANALYSIS OF DATA CENTER FOOTPRINT IN NORTH AMERICA
- 5.1 Analysis of current DC footprint in terms of IT load capacity and of Data Centers in the North America
- 5.2 Analysis of ley hotspots in the North America (top 15 hotspots will be analyzed in the region)
- 5.3 Analysis of overall spending on Data Center Infrastructure in North America
6 MARKET SIZE AND GROWTH FORECASTS (VALUE, USD)
- 6.1 By Type
- 6.1.1 By Solution Type
- 6.1.1.1 Power Distribution Solutions
- 6.1.1.1.1 Transfer Switches
- 6.1.1.1.2 Switchgear
- 6.1.1.1.3 Power Panels and Components
- 6.1.1.1.4 Others
- 6.1.1.2 Power Backup Solutions
- 6.1.1.2.1 UPS
- 6.1.1.2.2 Generators
- 6.1.1.1 Power Distribution Solutions
- 6.1.2 Service - Design and Consulting, Integration, Support and Maintenance
- 6.1.1 By Solution Type
- 6.2 By Data Center Type
- 6.2.1 Colocation Facilities
- 6.2.2 Enterprise/Edge Facilities
- 6.2.3 Hyperscale/Self-built Facilities
- 6.3 By End-User Industry
- 6.3.1 BFSI
- 6.3.2 IT and Telecom
- 6.3.3 Government and Defense
- 6.3.4 Manufacturing and Industrial
- 6.3.5 Media and Entertainment
- 6.3.6 Healthcare and Life Sciences
- 6.3.7 Retail and E-commerce
- 6.4 By Power Capacity
- 6.4.1 less than or equal to 500 kW
- 6.4.2 501 kW - 1 MW
- 6.4.3 1.1 - 3 MW
- 6.4.4 greater than 3 MW
- 6.5 By Tier Standard
- 6.5.1 Tier I and II
- 6.5.2 Tier III
- 6.5.3 Tier IV
- 6.6 By Country
- 6.6.1 United States
- 6.6.2 Canada
- 6.6.3 Mexico
7 COMPETITIVE LANDSCAPE
- 7.1 Market Share Analysis
- 7.2 Company Profiles (includes Global level Overview, Market level overview, Core Segments, Financials as available, Strategic Information, Market Rank/Share for key companies, Products and Services, and Recent Developments)
- 7.2.1 ABB Ltd
- 7.2.2 Schneider Electric
- 7.2.3 Vertiv Group Corp.
- 7.2.4 Eaton Corp. (incl. Tripp Lite)
- 7.2.5 Legrand (Raritan, Starline)
- 7.2.6 nVent (Enlogic)
- 7.2.7 Siemens AG
- 7.2.8 Cummins Inc.
- 7.2.9 Caterpillar Inc.
- 7.2.10 Generac Power Systems
- 7.2.11 Mitsubishi Electric
- 7.2.12 Delta Electronics
- 7.2.13 Huawei Technologies Co. Ltd.
- 7.2.14 Piller Power Systems
- 7.2.15 Kohler Co.
- 7.2.16 LayerZero Power Systems
- 7.2.17 Socomec Group
- 7.2.18 Panduit Corp.
- 7.2.19 Riello UPS
- 7.2.20 Power Innovations International
- 7.2.21 Starline (Legrand)
- 7.2.22 Powin Energy
- 7.2.23 Bloom Energy
8 MARKET OPPORTUNITIES AND FUTURE OUTLOOK
- 8.1 White-space and Unmet-Need Assessment

