
PUBLISHER: Mordor Intelligence | PRODUCT CODE: 1907292

PUBLISHER: Mordor Intelligence | PRODUCT CODE: 1907292
Industrial Packaging - Market Share Analysis, Industry Trends & Statistics, Growth Forecasts (2026 - 2031)
Industrial packaging market size in 2026 is estimated at USD 74.51 billion, growing from 2025 value of USD 70.99 billion with 2031 projections showing USD 94.93 billion, growing at 4.96% CAGR over 2026-2031.
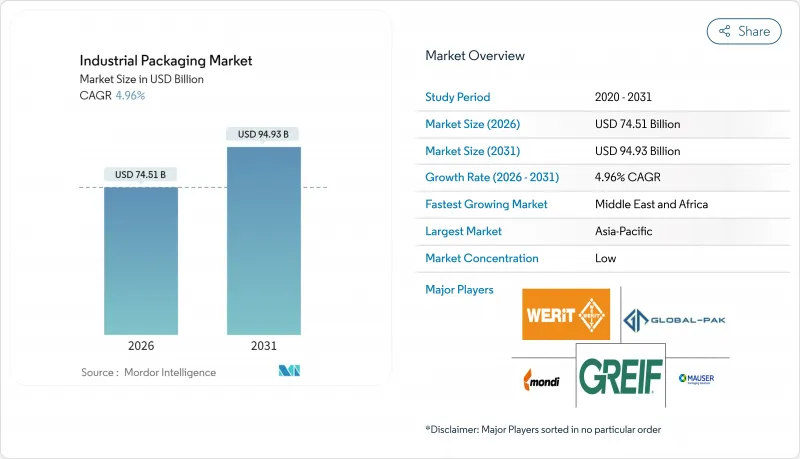
Demand resilience reflects the rise of e-commerce fulfillment, accelerating on-site packaging automation, and stricter regulatory frameworks that shape material choices and operational priorities across manufacturing sectors. E-commerce logistics require protective formats that survive multi-node shipping while keeping dimensional weight low, and automation investments help producers curb labor dependence amid tight labor markets. Asia-Pacific commanded 40.45% of 2024 revenue, supported by dense export-oriented manufacturing, while the Middle East and Africa are advancing the fastest at 6.34% CAGR to 2030 on the back of energy, infrastructure, and food processing investment pipelines.
Global Industrial Packaging Market Trends and Insights
Emergence of Sustainable and Recyclable Materials
Industrial buyers are making recycled-content mandates and corporate sustainability targets a central procurement criterion. The European Union requires 30% recycled content in plastic formats by 2030, compelling converters to overhaul feedstock sourcing. Cellulose-based composites deliver strength and moisture resistance suitable for food and pharma usage and meet ISO 14855 biodegradability thresholds. Pfizer's internal switch to recyclable formats cut packaging waste 25% yet complied with FDA 21 CFR 211 sterility rules. Producers hedge resin volatility by investing in bio-based coatings that replace PFAS while complying with emerging bans. As R&D scales, early adopters gain cost and compliance advantages that enhance customer retention.
Expansion of E-commerce and Cross-Border Trade Flows
E-commerce revenue in the United States hit USD 1.14 trillion in 2024, or 16.4% of retail sales. Multihandled parcels need cushioning and dimensional-weight efficient designs. Facilities shipping more than 2,000 orders per day are increasingly deploying robotics able to pack with 99.5% accuracy and cut labor costs by 40%. Tesla demonstrated an 18% materials drop after installing adaptive packaging systems. Regulatory complexity in pharmaceuticals pushes shippers toward standardized global formats that meet ICH labeling protocols across markets.
Volatile Resin and Steel Prices
Steel ranged from USD 650-850 / t in 2024, squeezing drum makers under long-term contracts. Polyethylene and polypropylene fluctuated 15-20%, with producers absorbing hits because raw inputs form 60-70% of cost. Dow's suppliers suffered 12% margin erosion. Flexible pricing and shorter contracts proliferate, yet renegotiations rose 25% over pre-2024 levels, straining relationships.
Other drivers and restraints analyzed in the detailed report include:
- Growth in Food-Grade and Pharma Bulk Logistics
- On-Site Packaging Automation Adoption
- PFAS / Micro-Plastic Bans on Barrier Coatings
For complete list of drivers and restraints, kindly check the Table Of Contents.
Segment Analysis
Intermediate bulk containers own the fastest 6.98% CAGR to 2031, propelled by hydrogen projects that require 350-700-bar composite vessels. Drums held 35.02% industrial packaging market share in 2025 and remain the backbone for multipurpose chemicals.
IBCs benefit from USD 7 billion in hydrogen hub funding, while steel drum demand faces raw-material swings yet enjoys entrenched UN certification familiarity. Flexible intermediate bulk containers adopt antistatic fabrics compliant with ATEX to serve explosive-atmosphere sectors.
Plastic dominated with 46.02% share in 2025 but faces mounting regulatory scrutiny. Paper and fiber options are set for a 6.61% CAGR as PFAS-free barrier coatings mature.
TAPPI measured 25% growth in barrier paperboard output, and automakers now mandate 30% recycled content in plastic returnable bins. Advanced cellulose films match oxygen barrier performance seen in polyethylene, enlarging paper's addressable use cases.
The Industrial Packaging Market Report is Segmented by Product (Intermediate Bulk Containers, Drums, Sacks, and More), Material (Plastics, Metal, Paper and Fiber-Based, and More), End-User Industry (Chemicals and Pharmaceuticals, Food and Beverage, Automotive, Oil Gas and Petrochemicals, and More), Packaging Capacity (<=50L, 51-500L, 501-1000L, and More), and Geography. The Market Forecasts are Provided in Terms of Value (USD).
Geography Analysis
Asia-Pacific supplied 40.12% of 2025 revenue thanks to export-heavy manufacturing and 8.1% growth in domestic packaging machinery output. Middle East and Africa will top regional growth charts at 6.18% CAGR, aided by USD 20 billion in petrochemical projects.
North America benefits from near-shoring as Mexico's exports rose 15% to USD 492 billion. Europe tightens circular-economy protocols that favor recyclable formats.
Saudi industrial policies drive demand for heavy-duty drums and composite IBCs meeting UN specs. India's food-processing investments worth INR 3,400 crore (USD 408 million) encourage fiber-based secondary packaging. Japanese chemical safety rules inspire high-barrier multilayer upgrades. The UAE's industrial strategy targets 25% manufacturing GDP share, stimulating regional pallet and container pools.
Africa's AfCFTA framework fosters intra-continental trade, opening gateways for standardized industrial packaging market solutions across borders. Sub-Saharan infrastructure work advances demand for large sacks and drums to move cement and chemicals. European ports expand EDI documentation to accelerate customs clearance, prompting adoption of globally harmonized labeling on bulk containers.
- Greif, Inc.
- Mauser Packaging Solutions Holding Company
- Mondi plc
- Smurfit WestRock
- Amcor plc
- International Paper Company
- Packaging Corporation of America
- Schutz GmbH & Co. KGaA
- WERIT Kunststoffwerke W. Schneider GmbH & Co. KG
- Tank Holding Corp.
- Visy Industries Holdings Pty Ltd
- Pact Group Holdings Ltd
- Brambles Limited (CHEP)
- Global-Pak, Inc.
- Nefab AB
- Snyder Industries, LLC
- Myers Container, LLC
- Veritiv Corporation
- Snyder Industries, Inc.
- Pyramid Technoplast Ltd
Additional Benefits:
- The market estimate (ME) sheet in Excel format
- 3 months of analyst support
TABLE OF CONTENTS
1 INTRODUCTION
- 1.1 Study Assumptions and Market Definition
- 1.2 Scope of the Study
2 RESEARCH METHODOLOGY
3 EXECUTIVE SUMMARY
4 MARKET LANDSCAPE
- 4.1 Market Overview
- 4.2 Market Drivers
- 4.2.1 Emergence of sustainable and recyclable materials
- 4.2.2 Expansion of e-commerce and cross-border trade flows
- 4.2.3 Growth in food-grade and pharma bulk logistics
- 4.2.4 On-site packaging automation adoption
- 4.2.5 Reusable packaging pool business models
- 4.2.6 Hydrogen-supply chain demand for composite IBCs
- 4.3 Market Restraints
- 4.3.1 Volatile resin and steel prices
- 4.3.2 Tightening global environmental regulations
- 4.3.3 PFAS / micro-plastic bans on barrier coatings
- 4.3.4 Near-shoring lowering long-haul packaging volumes
- 4.4 Industry Value Chain Analysis
- 4.5 Regulatory Landscape
- 4.6 Technological Outlook
- 4.7 Porter's Five Forces Analysis
- 4.7.1 Bargaining Power of Suppliers
- 4.7.2 Bargaining Power of Buyers
- 4.7.3 Threat of New Entrants
- 4.7.4 Threat of Substitutes
- 4.7.5 Intensity of Competitive Rivalry
- 4.8 The Impact of Macroeconomic Factors on the Market
5 MARKET SIZE AND GROWTH FORECASTS (VALUE)
- 5.1 By Product
- 5.1.1 Intermediate Bulk Containers (IBCs)
- 5.1.2 Drums
- 5.1.3 Sacks
- 5.1.4 Pails
- 5.1.5 Other Products
- 5.2 By Material
- 5.2.1 Plastics
- 5.2.2 Metal
- 5.2.3 Paper and Fiber-based
- 5.2.4 Other Materials
- 5.3 By End-user Industry
- 5.3.1 Chemicals and Pharmaceuticals
- 5.3.2 Food and Beverage
- 5.3.3 Automotive
- 5.3.4 Oil, Gas and Petrochemicals
- 5.3.5 Building and Construction
- 5.3.6 Other End-user Industries
- 5.4 By Packaging Capacity
- 5.4.1 <= 50 L
- 5.4.2 51 - 500 L
- 5.4.3 501 - 1,000 L
- 5.4.4 1,001 - 2,000 L
- 5.4.5 > 2,000 L
- 5.5 By Geography
- 5.5.1 North America
- 5.5.1.1 United States
- 5.5.1.2 Canada
- 5.5.1.3 Mexico
- 5.5.2 South America
- 5.5.2.1 Brazil
- 5.5.2.2 Argentina
- 5.5.2.3 Rest of South America
- 5.5.3 Europe
- 5.5.3.1 Germany
- 5.5.3.2 United Kingdom
- 5.5.3.3 France
- 5.5.3.4 Spain
- 5.5.3.5 Italy
- 5.5.3.6 Rest of Europe
- 5.5.4 Asia-Pacific
- 5.5.4.1 China
- 5.5.4.2 Japan
- 5.5.4.3 India
- 5.5.4.4 Australia
- 5.5.4.5 South Korea
- 5.5.4.6 Rest of Asia-Pacific
- 5.5.5 Middle East and Africa
- 5.5.5.1 Middle East
- 5.5.5.1.1 Saudi Arabia
- 5.5.5.1.2 United Arab Emirates
- 5.5.5.1.3 Turkey
- 5.5.5.1.4 Rest of Middle East
- 5.5.5.2 Africa
- 5.5.5.2.1 South Africa
- 5.5.5.2.2 Kenya
- 5.5.5.2.3 Rest of Africa
- 5.5.5.1 Middle East
- 5.5.1 North America
6 COMPETITIVE LANDSCAPE
- 6.1 Market Concentration
- 6.2 Strategic Moves
- 6.3 Market Share Analysis
- 6.4 Company Profiles (includes Global level Overview, Market level overview, Core Segments, Financials as available, Strategic Information, Market Rank/Share for key companies, Products and Services, and Recent Developments)
- 6.4.1 Greif, Inc.
- 6.4.2 Mauser Packaging Solutions Holding Company
- 6.4.3 Mondi plc
- 6.4.4 Smurfit WestRock
- 6.4.5 Amcor plc
- 6.4.6 International Paper Company
- 6.4.7 Packaging Corporation of America
- 6.4.8 Schutz GmbH & Co. KGaA
- 6.4.9 WERIT Kunststoffwerke W. Schneider GmbH & Co. KG
- 6.4.10 Tank Holding Corp.
- 6.4.11 Visy Industries Holdings Pty Ltd
- 6.4.12 Pact Group Holdings Ltd
- 6.4.13 Brambles Limited (CHEP)
- 6.4.14 Global-Pak, Inc.
- 6.4.15 Nefab AB
- 6.4.16 Snyder Industries, LLC
- 6.4.17 Myers Container, LLC
- 6.4.18 Veritiv Corporation
- 6.4.19 Snyder Industries, Inc.
- 6.4.20 Pyramid Technoplast Ltd
7 MARKET OPPORTUNITIES AND FUTURE OUTLOOK
- 7.1 White-space and Unmet-need Assessment

