
PUBLISHER: Mordor Intelligence | PRODUCT CODE: 1910446

PUBLISHER: Mordor Intelligence | PRODUCT CODE: 1910446
Ready Mix Concrete - Market Share Analysis, Industry Trends & Statistics, Growth Forecasts (2026 - 2031)
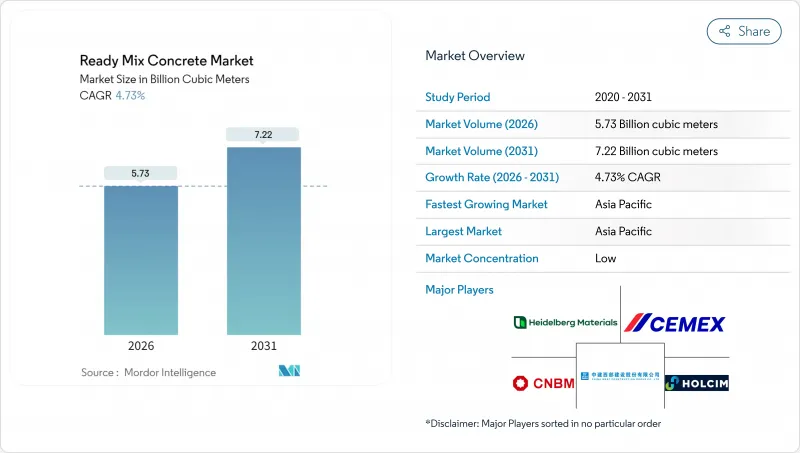
The Ready Mix Concrete Market was valued at 5.47 billion cubic meters in 2025 and estimated to grow from 5.73 billion cubic meters in 2026 to reach 7.22 billion cubic meters by 2031, at a CAGR of 4.73% during the forecast period (2026-2031).
Robust public-sector pipelines in Asia-Pacific and North America underpin this volume growth, while digital dispatch platforms and telematics improve fleet productivity, lower delivery variability, and strengthen supplier margins. Low-carbon mix designs that replace clinker with supplementary cementitious materials gain traction because governments attach compliance requirements to infrastructure spending. Raw-material price spikes since 2019 have narrowed producer spreads, yet suppliers that backward-integrate into aggregates and cement-and adopt real-time quality monitoring-sustain healthier earnings. At the same time, mergers such as Quikrete-Summit and CRH's regional asset buys indicate that scale economies and geographic density remain critical levers in the ready mix concrete market.
Global Ready Mix Concrete Market Trends and Insights
Rapid Urbanization and Housing Demand
Fast-growing urban populations in India, Indonesia, and Vietnam continue to translate into large housing backlogs. Developers favor off-site batched concrete for its strength uniformity, compliance with evolving building codes, and shorter project cycles. Despite an overhang in China's property segment, factory construction and logistics hubs still consume sizeable volumes, cushioning regional volatility. Combined, these forces extend the demand runway for the ready mix concrete market well into the next decade.
Government Mega-Infrastructure Pipelines
Multi-year budget commitments provide visibility that allows producers to green-light capacity additions. The United States allocated USD 214 billion for transportation construction in 2024, while India's National Infrastructure Pipeline covers 7,400 projects ranging from highways to renewable power. Similar agendas in Indonesia and Australia lock in long-cycle demand, ensuring that plant utilizations remain above breakeven even during residential downturns.
Raw-Material Price Volatility
Cement prices have risen 38% and aggregates 31% since 2019, squeezing spreads when contract structures delay pass-through. Geopolitical energy shocks and trucking shortages amplify cost unpredictability, compelling producers to diversify sourcing and adopt index-linked pricing. Customers, however, increasingly demand fixed-price contracts, transferring risk back to suppliers and tempering growth in the ready mix concrete market.
Other drivers and restraints analyzed in the detailed report include:
- Preference for Quality-Controlled Off-Site Batching
- Environmental Push for Material Efficiency
- Short Workable Life and Logistics Risk
For complete list of drivers and restraints, kindly check the Table Of Contents.
Segment Analysis
Transit mixed concrete accounted for 72.65% of the ready mix concrete market in 2025, supported by vast truck fleets, established orders, and competitive delivered costs. Shrink mixed concrete, while only a fraction of volume, is projected to post a 5.66% CAGR as builders tackle longer transport distances and tighter on-site pouring windows. Adoption is rising in Latin American metros where traffic congestion narrows scheduling buffers. Central mixed concrete remains preferred for dams and nuclear projects that specify peak uniformity, though its share inches forward only when regional megaprojects come to tender.
The ready mix concrete market size attributed to shrink mixed solutions is expected to grow by 2030, supported by performance admixtures that maintain slump for up to three hours. Producers invest in dual-purpose drum plants capable of both shrink and transit mixes to serve evolving demand with minimal downtime.
The Ready Mix Concrete Market Report is Segmented by Product Type (Central Mixed, Shrink Mixed, and Transit Mixed), End-Use Sector (Commercial, Industrial and Institutional, Infrastructure, and Residential), and Geography (Asia-Pacific, North America, Europe, South America, and Middle-East and Africa). The Market Forecasts are Provided in Terms of Volume (Cubic Meters).
Geography Analysis
Asia-Pacific dominates the ready mix concrete market with 76.55% share in 2025 and a forecast 5.06% CAGR to 2031. India's USD 1.4 trillion National Infrastructure Pipeline encompasses highways, dedicated freight corridors, and 50 million affordable homes, ensuring multi-year demand visibility. Indonesia's USD 412 billion connectivity blueprint, Vietnam's manufacturing boom, and continued Chinese public-works spending offset softness in the mainland residential sector. High-volume producers install additional plants along economic corridors such as the Delhi-Mumbai Expressway to cut haulage distances and meet carbon targets.
North America contributes stable growth as federal funding lines disburse for bridges, port dredging, and electric vehicle charging corridors. The United States poured roughly 400 million yd3 (USD 64 billion) in 2023 and expects mid-single-digit volume increases in 2025-2026. Canada advances urban transit, while Mexico's near-shoring wave fuels industrial parks along the border.
Europe's energy shock trimmed 2024 output, yet policy stimuli centered on renovation and on-shore wind platforms sustain baseline demand. Carbon price escalation under CBAM accelerates the migration to low-clinker mixes, allowing environmentally differentiated suppliers to expand shares despite broader construction contraction. Eastern European markets tap EU cohesion funds for rail and wastewater upgrades, lifting long-term tonnage potential and giving the ready mix concrete market renewed momentum region-wide.
- Adani Group
- BBMG Corporation
- Boral Limited
- Buzzi S.p.A
- CEMEX SAB de CV
- China National Building Material Group Corporation
- China West Construction Group
- CRH
- Foshan Huijiang Concrete Co., Ltd.
- Heidelberg Materials
- Holcim
- Martin Marietta Materials
- OYAK Cimento
- SAMPYO Group
- Titan Cement
- UltraTech Cement Ltd.
- Vicat SA
- Votorantim Cimentos
Additional Benefits:
- The market estimate (ME) sheet in Excel format
- 3 months of analyst support
TABLE OF CONTENTS
1 Introduction
- 1.1 Study Assumptions and Market Definition
- 1.2 Scope of the Study
2 Research Methodology
3 Executive Summary
4 Market Landscape
- 4.1 Market Overview
- 4.2 Market Drivers
- 4.2.1 Rapid urbanization and housing demand
- 4.2.2 Government mega-infrastructure pipelines
- 4.2.3 Preference for quality-controlled off-site batching
- 4.2.4 Environmental push for material efficiency
- 4.2.5 Digital dispatch and telematics optimise delivery
- 4.3 Market Restraints
- 4.3.1 Raw-material price volatility
- 4.3.2 Short workable life/logistics risk
- 4.3.3 Proliferation of on-site volumetric mixers
- 4.4 Value Chain Analysis
- 4.5 Porter's Five Forces
- 4.5.1 Bargaining Power of Suppliers
- 4.5.2 Bargaining Power of Buyers
- 4.5.3 Threat of Substitutes
- 4.5.4 Threat of New Entrants
- 4.5.5 Competitive Rivalry
5 Market Size and Growth Forecasts (Volume)
- 5.1 By Product Type
- 5.1.1 Central Mixed
- 5.1.2 Shrink Mixed
- 5.1.3 Transit Mixed
- 5.2 By End-use Sector
- 5.2.1 Commercial
- 5.2.2 Industrial and Institutional
- 5.2.3 Infrastructure
- 5.2.4 Residential
- 5.3 By Geography
- 5.3.1 Asia-Pacific
- 5.3.1.1 China
- 5.3.1.2 India
- 5.3.1.3 Japan
- 5.3.1.4 South Korea
- 5.3.1.5 Australia
- 5.3.1.6 Indonesia
- 5.3.1.7 Vietnam
- 5.3.1.8 Rest of Asia-Pacific
- 5.3.2 North America
- 5.3.2.1 United States
- 5.3.2.2 Canada
- 5.3.2.3 Mexico
- 5.3.3 Europe
- 5.3.3.1 Germany
- 5.3.3.2 France
- 5.3.3.3 United Kingdom
- 5.3.3.4 Italy
- 5.3.3.5 Spain
- 5.3.3.6 Russia
- 5.3.3.7 Rest of Europe
- 5.3.4 South America
- 5.3.4.1 Brazil
- 5.3.4.2 Argentina
- 5.3.4.3 Rest of South America
- 5.3.5 Middle-East and Africa
- 5.3.5.1 Saudi Arabia
- 5.3.5.2 United Arab Emirates
- 5.3.5.3 Rest of Middle-East and Africa
- 5.3.1 Asia-Pacific
6 Competitive Landscape
- 6.1 Market Concentration
- 6.2 Strategic Moves
- 6.3 Market Share (%)/Ranking Analysis
- 6.4 Company Profiles (includes Global level Overview, Market level overview, Core Segments, Financials as available, Strategic Information, Market Rank/Share, Products and Services, Recent Developments)
- 6.4.1 Adani Group
- 6.4.2 BBMG Corporation
- 6.4.3 Boral Limited
- 6.4.4 Buzzi S.p.A
- 6.4.5 CEMEX SAB de CV
- 6.4.6 China National Building Material Group Corporation
- 6.4.7 China West Construction Group
- 6.4.8 CRH
- 6.4.9 Foshan Huijiang Concrete Co., Ltd.
- 6.4.10 Heidelberg Materials
- 6.4.11 Holcim
- 6.4.12 Martin Marietta Materials
- 6.4.13 OYAK Cimento
- 6.4.14 SAMPYO Group
- 6.4.15 Titan Cement
- 6.4.16 UltraTech Cement Ltd.
- 6.4.17 Vicat SA
- 6.4.18 Votorantim Cimentos
7 Market Opportunities and Future Outlook
- 7.1 White-space and Unmet-Need Assessment
8 Key Strategic Questions for CEOs

