
PUBLISHER: Mordor Intelligence | PRODUCT CODE: 1910457

PUBLISHER: Mordor Intelligence | PRODUCT CODE: 1910457
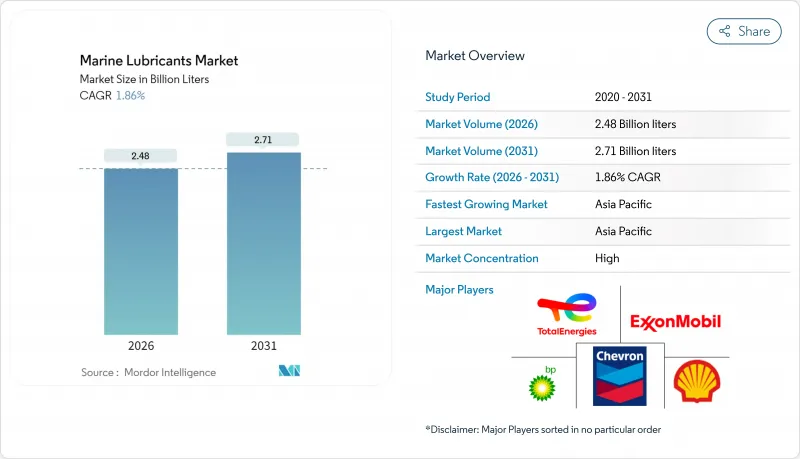
Marine Lubricants - Market Share Analysis, Industry Trends & Statistics, Growth Forecasts (2026 - 2031)
The Marine Lubricants Market is expected to grow from 2.43 billion liters in 2025 to 2.48 billion liters in 2026 and is forecast to reach 2.71 billion liters by 2031 at 1.86% CAGR over 2026-2031.
This stable upward trajectory reflects tightening environmental rules, notably the IMO 2020 sulfur cap, coupled with steady fleet expansion and modernization programs that push operators toward premium-grade formulations. Vessel owners increasingly favor lubricants that preserve engine cleanliness when burning very-low-sulfur fuel or operating dual-fuel LNG engines. This shift raises average selling prices even as slow-steaming lowers per-voyage consumption. Growing offshore wind construction, alongside greater deployment of dynamic-positioning vessels, further elevates demand for high-performance hydraulic fluids and thruster oils. Suppliers with global blending networks, robust technical service, and digital condition-monitoring platforms are positioned to capture greater value as the marine lubricants market migrates toward service-intensive contracts.
Global Marine Lubricants Market Trends and Insights
Rising Global Seaborne Trade Volume
Container throughput growth and resilient bulk commodity flows sustain lubricant uptake even as efficiency technologies lower consumption per voyage. Diversified supply chains extend sailing distances, and optimized routing keeps engines running longer between ports, both of which lift total lubricant demand. Asian yards such as Yangzijiang Shipbuilding have full order books, guaranteeing sizable initial-fill requirements that convert to multi-year service contracts. Higher voyage frequency on near-shoring routes offsets slow-steaming practices, resulting in a net rise in annual operating hours. Consequently, every major vessel class registers incremental lubricant volume gains, ensuring steady expansion of the marine lubricants market.
Fleet Modernisation & Expansion in Asia
China's enlarged shipbuilding capacity and India's port upgrades accelerate the replacement of aging vessels with designs carrying advanced, higher-temperature engines. These engines favor synthetic or semi-synthetic lubricants with elevated base-number and oxidation-resistance profiles. Installation of centralized lubrication systems and onboard sensors enables operators to migrate toward condition-based maintenance contracts bundled with premium lubricant supply. Japanese and South Korean builders are adding dual-fuel engines on LNG carriers, further raising demand for specialized cylinder oils that neutralize acid produced during gas-diesel cycles. Over the long term, the sheer scale of regional fleet renewal underpins the largest absolute gain in the marine lubricants market worldwide.
Shift Toward Bio-/Biodegradable Lubricants
EALs command significant price premiums over mineral grades, prompting some operators to ration usage or extend drains to contain operating budgets. Bio-based oils exhibit weaker oxidative stability under the high temperatures typical in main propulsion engines, limiting penetration to auxiliary gear or stern-tube applications. Feedstock competition from food and biofuel sectors adds price volatility, while limited base-stock production capacity constrains large-scale adoption. Plant-based alternatives sometimes require specialized storage and stricter moisture control, adding complexity for ship crews. These challenges slow volume growth even though regulatory incentives remain strong.
Other drivers and restraints analyzed in the detailed report include:
- IMO-2020 Sulfur Cap Boosting Demand for Premium Lubricants
- Offshore-Wind Installation Vessel Boom
- Stringent Environmental & Disposal Regulations
For complete list of drivers and restraints, kindly check the Table Of Contents.
Segment Analysis
Trunk piston engine oil (TPEO) accounted for 41.85% of the marine lubricants market share in 2025, as low-speed and medium-speed engines have large sump capacities and require regular top-ups to maintain the base number. Extended drain programs on modern dual-fuel ships still rely on high-alkalinity TPEO to neutralize acids derived from low-sulfur fuel blends. The marine lubricants market size for TPEO remained resilient during 2024-25 as container and bulker operators favored reputable brands with strong deposit control. Parallel demand for system oils in auxiliary engines supports steady volumes, while cylinder oils continue to hold a niche role in two-stroke engines that employ separate injection.
Demand dynamics shift fastest in stern-tube oils, projected to rise at a 2.04% CAGR through 2031. The use of advanced face seals and stricter zero-discharge regulations is pushing owners toward biodegradable synthetic esters, despite the higher cost per liter. Gear oils are expected to receive a modest uplift from the increasing adoption of podded propulsion and controllable-pitch propellers, which operate under extreme load fluctuations. Meanwhile, hydraulic fluid volumes track the rollout of automated deck machinery and dynamic-positioning systems used on installation and service vessels. Due to routine bearing maintenance and niche equipment such as onboard refrigeration compressors, greases, and other specialty lubricants.
Mineral oil captured 71.95% of the marine lubricants market size in 2025, reflecting its cost efficiency and wide-ranging OEM approvals. Reliable global supply chains enable bunkering hubs to maintain sufficient stocks, ensuring operators can adhere to specifications throughout their voyages. Synthetic PAO and ester blends dominate premium niches where high film strength and oxidation resistance outweigh added expense, especially on high-output engines fitted to LNG carriers. Superior viscosity index characteristics deliver energy savings that partly offset the higher purchase price, fostering gradual substitution in performance-critical systems.
Although just a fraction of the total volume, bio-based lubricants are advancing at a 2.15% CAGR, driven by EAL mandates in European and U.S. coastal waters. Plant-derived esters offer excellent lubricity and low toxicity, but require antioxidant packages to mitigate thermal stress in propulsion engines. Hybrid formulations blending synthetic ester with low-viscosity PAO demonstrate improved additive response, widening the application envelope into moderate-temperature gearbox and thruster systems. The availability of feedstock and the scale-up of esterification capacity will determine how quickly bio-based variants penetrate the mainstream marine lubricants market.
The Marine Lubricants Market Report is Segmented by Lubricant Type (System Oil, Cylinder Oil, Stern-Tube Oils, and More), Base Stock (Mineral Oil, Synthetic, Bio-Based), Ship Type (Bulker, Tanker, Container, and More), Application (Main Propulsion Engine, Auxiliary Engine and Generators, and More), Distribution Channel (Direct Supply, Distributor/Agent, and More), and Geography (Asia-Pacific, North America, Europe, and More).
Geography Analysis
Asia-Pacific retained 46.35% of the marine lubricants market share in 2025 and is projected to expand at a 2.05% CAGR through 2031. China's dominance in newbuild deliveries ensures high initial-fill volumes, while its massive merchant fleet drives continuous replacement demand. India's Sagarmala port modernization and dedicated coastal shipping corridors stimulate lubricant consumption, particularly for trunk piston oils in bulkers and tankers plying the subcontinent's coasts. Japanese and South Korean yards are pushing high-spec LNG carriers with dual-fuel propulsion that require premium cylinder oils, thereby spreading advanced formulation standards across the region. Southeast Asian transshipment hubs, supported by manufacturing diversification trends, lengthen regional voyage legs and sustain steady lubricant uptake.
Europe commands a pivotal position due to its stringent environmental rules that accelerate adoption of EALs and low-sulfur-compatible oils. The Mediterranean ECA, effective since May 2025, forces owners to validate fuel-lubricant compatibility, reinforcing preference for branded suppliers with deep technical expertise. Northern Europe's offshore wind build-out intensifies demand for synthetic thruster oils and hydraulic fluids specifically designed for cold weather conditions. Advanced emission controls in Baltic and North Sea zones position the region as an early adopter of bio-based stern-tube lubricants.
North America benefits from offshore wind leasing on the U.S. Atlantic seaboard, triggering newbuild Jones Act installation vessels that consume high-performance hydraulic and thruster lubricants. Canada's Arctic tonnage and Great Lakes trade need cold-flow-optimized oils, while Gulf of Mexico offshore support vessels sustain the baseline demand for trunk piston and hydraulic grades. South America and the Middle East and Africa remain emerging opportunities: Brazil's pre-salt activities and West Africa's deep-water prospects support OSV growth, but currency and political risks temper investment. Middle East bunker hubs like Fujairah anchor transshipment demand, although regional geopolitical tensions can intermittently disrupt lubricant volumes.
- ADNOC Distribution
- BP plc (Castrol)
- Chevron Corporation
- China Petrochemical Corporation
- ENEOS Corporation
- ENI S.p.A.
- Exxon Mobil Corporation
- FUCHS SE
- Gazprom Neft PJSC
- Gulf Oil International Ltd
- Idemitsu Kosan Co. Ltd
- Indian Oil Corporation Ltd
- LUKOIL
- Panolin AG
- Petronas Lubricants International
- Phillips 66 Lubricants
- Shell plc
- TotalEnergies SE
- Valvoline
Additional Benefits:
- The market estimate (ME) sheet in Excel format
- 3 months of analyst support
TABLE OF CONTENTS
1 Introduction
- 1.1 Study Assumptions and Market Definition
- 1.2 Scope of the Study
2 Research Methodology
3 Executive Summary
4 Market Landscape
- 4.1 Market Overview
- 4.2 Market Drivers
- 4.2.1 Rising global seaborne trade volume
- 4.2.2 Fleet modernisation and expansion in Asia
- 4.2.3 IMO-2020 sulfur cap boosting demand for premium lubricants
- 4.2.4 Offshore-wind installation vessel boom
- 4.2.5 Dual-fuel LNG engines needing specialised cylinder oils
- 4.3 Market Restraints
- 4.3.1 Shift toward bio-/biodegradable lubricants
- 4.3.2 Stringent environmental and disposal regulations
- 4.3.3 Slow-steaming practices lowering feed-rates
- 4.3.4 On-board oil purification / re-use systems
- 4.4 Value Chain Analysis
- 4.5 Regulatory Landscape
- 4.6 Porter's Five Forces
- 4.6.1 Bargaining Power of Suppliers
- 4.6.2 Bargaining Power of Buyers
- 4.6.3 Threat of New Entrants
- 4.6.4 Threat of Substitutes
- 4.6.5 Degree of Competition
5 Market Size and Growth Forecasts (Volume)
- 5.1 By Lubricant Type
- 5.1.1 System Oil
- 5.1.2 Cylinder Oil
- 5.1.3 Trunk Piston Engine Oil
- 5.1.4 Stern-Tube Oils
- 5.1.5 Gear Oils
- 5.1.6 Hydraulic Fluids
- 5.1.7 Greases
- 5.1.8 Other Lubricants
- 5.2 By Base Stock
- 5.2.1 Mineral Oil
- 5.2.2 Synthetic
- 5.2.3 Bio-based
- 5.3 By Ship Type
- 5.3.1 Bulker
- 5.3.2 Tanker
- 5.3.3 Container
- 5.3.4 General Cargo
- 5.3.5 Passenger and Cruise
- 5.3.6 Offshore Support Vessel
- 5.3.7 Naval
- 5.3.8 Others
- 5.4 By Application
- 5.4.1 Main Propulsion Engine
- 5.4.2 Auxiliary Engine and Generators
- 5.4.3 Gearbox and Transmission
- 5.4.4 Stern-Tube and Bearings
- 5.4.5 Air-Compressor and Hydraulic Systems
- 5.4.6 Others
- 5.5 By Distribution Channel
- 5.5.1 Direct Supply
- 5.5.2 Distributor/Agent
- 5.5.3 Online Platforms
- 5.6 By Geography
- 5.6.1 Asia-Pacific
- 5.6.1.1 China
- 5.6.1.2 India
- 5.6.1.3 Japan
- 5.6.1.4 South Korea
- 5.6.1.5 Malaysia
- 5.6.1.6 Thailand
- 5.6.1.7 Indonesia
- 5.6.1.8 Vietnam
- 5.6.1.9 Rest of Asia-Pacific
- 5.6.2 North America
- 5.6.2.1 United States
- 5.6.2.2 Canada
- 5.6.2.3 Mexico
- 5.6.3 Europe
- 5.6.3.1 Germany
- 5.6.3.2 United Kingdom
- 5.6.3.3 France
- 5.6.3.4 Italy
- 5.6.3.5 Spain
- 5.6.3.6 Nordic Countries
- 5.6.3.7 Turkey
- 5.6.3.8 Russia
- 5.6.3.9 Rest of Europe
- 5.6.4 South America
- 5.6.4.1 Brazil
- 5.6.4.2 Argentina
- 5.6.4.3 Colombia
- 5.6.4.4 Rest of South America
- 5.6.5 Middle East and Africa
- 5.6.5.1 Saudi Arabia
- 5.6.5.2 South Africa
- 5.6.5.3 Rest of Middle-East and Africa
- 5.6.1 Asia-Pacific
6 Competitive Landscape
- 6.1 Market Concentration
- 6.2 Strategic Moves
- 6.3 Market Share (%)/Ranking Analysis
- 6.4 Company Profiles (includes Global level Overview, Market level overview, Core Segments, Financials as available, Strategic Information, Market Rank/Share, Products and Services, Recent Developments)
- 6.4.1 ADNOC Distribution
- 6.4.2 BP plc (Castrol)
- 6.4.3 Chevron Corporation
- 6.4.4 China Petrochemical Corporation
- 6.4.5 ENEOS Corporation
- 6.4.6 ENI S.p.A.
- 6.4.7 Exxon Mobil Corporation
- 6.4.8 FUCHS SE
- 6.4.9 Gazprom Neft PJSC
- 6.4.10 Gulf Oil International Ltd
- 6.4.11 Idemitsu Kosan Co. Ltd
- 6.4.12 Indian Oil Corporation Ltd
- 6.4.13 LUKOIL
- 6.4.14 Panolin AG
- 6.4.15 Petronas Lubricants International
- 6.4.16 Phillips 66 Lubricants
- 6.4.17 Shell plc
- 6.4.18 TotalEnergies SE
- 6.4.19 Valvoline
7 Market Opportunities and Future Outlook
- 7.1 White-space and Unmet-Need Assessment

