
PUBLISHER: Mordor Intelligence | PRODUCT CODE: 1910546

PUBLISHER: Mordor Intelligence | PRODUCT CODE: 1910546
LED Lighting - Market Share Analysis, Industry Trends & Statistics, Growth Forecasts (2026 - 2031)
The LED lighting market is expected to grow from USD 104.93 billion in 2025 to USD 110.76 billion in 2026 and is forecast to reach USD 145.01 billion by 2031 at 5.55% CAGR over 2026-2031.
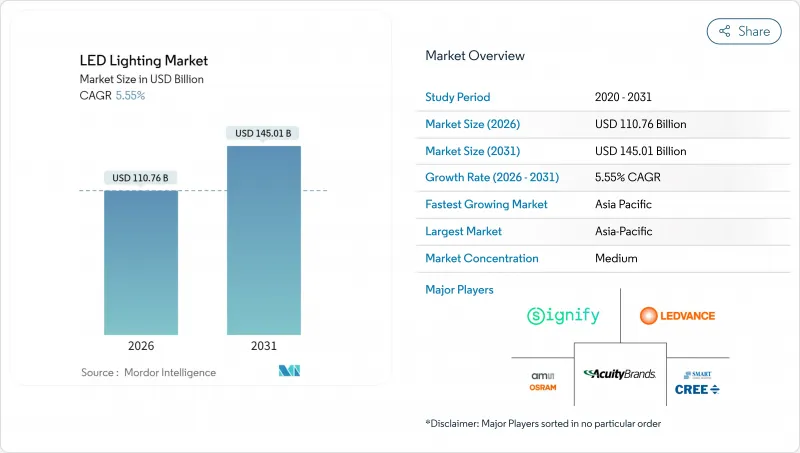
This trajectory illustrates the sector's transition from rapid early adoption to a stable, replacement-driven phase, where quality differentiation and integrated controls drive competitive success. Government phase-outs of inefficient lamps, a secondary replacement wave for installations completed between 2014 and 2016, and the acceleration of smart-city programs form the primary demand engines. Manufacturers that integrate LED hardware with sensors, network interfaces, and value-added services tend to secure larger contracts and longer customer relationships. Meanwhile, supply-side consolidation, illustrated by Samsung's planned exit, intensifies rivalry among remaining suppliers as they race to secure channel loyalty and defend margins.
Global LED Lighting Market Trends and Insights
Government Incentives and Phase-Outs Drive Market Transformation
Policy intervention remains the strongest accelerator for the LED lighting market. Australia's Greenhouse and Energy Minimum Standards regulation, effective March 2026, raises minimum efficacy thresholds and extends the incandescent ban through 2030, providing manufacturers with clear compliance schedules and mitigating the risk of stranded inventory. Similar dynamics in the United States, where federal standards guide state and municipal procurement, create predictable bulk-purchase pipelines. Citywide conversions such as Philadelphia's 131,000-fixture program, which delivered 50% energy savings and USD 2.4 million annual savings, prove the financial logic to other municipalities. These policies narrow the viable product spectrum to compliant, higher-quality lamps and luminaires, raising the average selling price and rewarding brands with strong certification portfolios.
Smart City Infrastructure Accelerates LED Adoption
Smart-city investments convert lighting into a data backbone for urban management, raising the strategic value of each luminaire. Milton Keynes' deployment of 20,000 sensor-enabled LED streetlights cut energy use by 40% while adding traffic and air-quality monitoring functions.Parramatta achieved 65% energy savings and integrated lighting nodes into city-wide IoT networks that support revenue-generating services beyond illumination. These examples illustrate how the LED lighting market is shifting from commodity product sales to multidisciplinary infrastructure projects that command long-term service contracts and data platform revenue streams.
High Upfront Costs Limit Premium Segment Penetration
Price differentials between entry-level lamps and premium connected luminaires remain sizeable, deterring adoption in cost-sensitive regions. Although component costs decline annually, advanced features such as tunable spectra, integrated sensors, and robust thermal management add to the bill-of-materials pressure. The result is a bifurcated LED lighting market where basic models compete purely on price, while premium offerings rely on lifecycle savings narratives that some buyers still discount. Emerging markets, small businesses, and municipal budgets with limited capital face the sharpest constraints, resulting in slower penetration of high-margin smart and human-centric products.
Other drivers and restraints analyzed in the detailed report include:
- Commercial Construction Boom Fuels Retrofit Demand
- Secondary Replacement Cycle Creates Sustained Demand
- Supply Chain Consolidation Creates Market Volatility
For complete list of drivers and restraints, kindly check the Table Of Contents.
Segment Analysis
Luminaires captured 61.45% of 2025 revenue, demonstrating how buyers prefer integrated form factors that combine optics, heat sinks, and controls. This dominance has increased the market share of full-fixture vendors in the LED lighting market, which can tailor products to meet specific architectural and industrial specifications. The luminaire category commands higher average selling prices and longer replacement intervals, stabilizing cash flows for manufacturers. Meanwhile, the lamp segment is expected to expand at an 8.29% CAGR, driven by the secondary replacement wave in residential and light-commercial sockets. Cree LED's XLamp XFL, delivering up to 20,000 lumens in compact footprints, exemplifies lamp innovation that supplies specific performance gains for portable lighting.
The secondary replacement trend elevates lamps as owners seek quick performance upgrades without the need for rewiring or ceiling work. Nonetheless, the LED lighting market continues to reward luminaire makers that integrate networked controls and support utility rebate paperwork, deepening customer lock-in. Hybrid strategies, in which firms offer retrofit lamps alongside new connected fixtures, help address both budget-driven and feature-seeking buyers.
Wholesale and retail outlets held a 53.55% share in 2025 because contractors and facility managers rely on immediate product availability, technical guidance, and after-sales support. This channel anchors the LED lighting market by safeguarding project timelines and ensuring compliance with local codes and specifications. E-commerce, however, is on track for the fastest 6.62% CAGR through 2031, as residential consumers and small businesses increasingly adopt direct-to-door fulfillment. Manufacturers such as Havells tapped a dual-channel model by opening a fully stocked warehouse in Anderson, South Carolina, while maintaining relationships with independent lighting agents.
Digital purchase journeys capitalize on catalog standardization and rich media content that demystify the product selection process. Yet complex commercial retrofits still favor wholesalers who provide photometric layouts, rebate coordination, and on-site troubleshooting. Consequently, omni-channel strategies that blend online configurators with local pickup or rapid delivery serve the broadest customer base.
The LED Lighting Market Report is Segmented by Product Type (Lamps, and Luminaires/Fixtures), Distribution Channel (Direct Sales, Wholesale/Retail, and More), Installation Type (New Installation, and Retrofit Installation), Application (Commercial Offices, Retail Stores, and More), End User (Indoor, Outdoor, and More), and Geography (North America, South America, and More). The Market Forecasts are Provided in Terms of Value (USD).
Geography Analysis
The Asia-Pacific region led the LED lighting market, accounting for a 42.10% revenue share in 2025, driven by China's large-scale manufacturing and India's infrastructure development. Government schemes such as India's UJALA bulb distribution and widespread smart-city programs propel continuous demand, while domestic producers leverage cost advantages to supply foreign projects. The region is also expected to exhibit the fastest growth, with a 7.58% CAGR to 2031, underpinned by accelerating urbanization, stimulus-backed construction, and a growing preference for connected lighting ecosystems. Korean and Japanese component firms contribute high-efficacy chips, allowing regional fixture brands to compete globally on both performance and price.
North America maintains a robust position through stringent energy codes, ESCO contracting, and federal infrastructure spending that prioritizes LED conversions. State-level incentives combined with municipal sustainability targets drive high penetration in streetlights and public facilities. Commercial new-build projects integrate networked luminaires to meet occupant-wellness standards, while warehousing and logistics facilities migrate to high-bay LEDs for operational savings. Supply-chain disruptions, however, cause occasional project delays, prompting many buyers to dual-source drivers and chip packages.
Europe benefits from the Energy Performance of Buildings Directive and the Renovation Wave that compel deep retrofits across member states. Utility tariffs and carbon taxes strengthen the economic case for LED upgrades, and local content rules favor European brands for public tenders. Scandinavian cities are spearheading human-centric lighting pilots, advancing the adoption of tunable white fixtures. Conversely, the Middle East and Africa exhibit heterogeneous development; oil-rich Gulf states invest in smart-city showcase projects, while many African nations focus on basic electrification and rely on donor-funded LED rollouts. Latin America is experiencing gradual progress as energy subsidies decline and public lighting concessions encourage the adoption of performance-based contracting.
- Signify N.V.
- ams OSRAM AG
- Acuity Brands Lighting Inc.
- Cree LED (SMART Global Holdings)
- LEDVANCE GmbH
- Zumtobel Group AG
- Nichia Corporation
- Seoul Semiconductor Co. Ltd.
- Everlight Electronics Co. Ltd.
- Dialight plc
- LSI Industries Inc.
- Havells India Ltd.
- Syska LED Lights Pvt. Ltd.
- Opple Lighting Co. Ltd.
- Yankon Group Co. Ltd.
- Fagerhult Group
- Current Lighting Solutions LLC
- Leedarson Lighting Co. Ltd.
- TOSPO Lighting Co. Ltd.
- MLS Co. Ltd.
- Hubbell Lighting Inc.
- Panasonic Corporation (Lighting)
- Bridgelux Inc.
- Valmont Industries (Lighting)
Additional Benefits:
- The market estimate (ME) sheet in Excel format
- 3 months of analyst support
TABLE OF CONTENTS
1 INTRODUCTION
- 1.1 Study Assumptions and Market Definition
- 1.2 Scope of the Study
2 RESEARCH METHODOLOGY
3 EXECUTIVE SUMMARY
4 MARKET LANDSCAPE
- 4.1 Market Overview
- 4.2 Market Drivers
- 4.2.1 Government incentives and phase-outs of incandescent/CFL lighting
- 4.2.2 Falling LED prices and efficiency gains
- 4.2.3 Smart-city infrastructure roll-outs
- 4.2.4 Commercial construction and retrofit boom
- 4.2.5 Secondary replacement cycle for 2014-2016 LED installs
- 4.2.6 Rise of human-centric (circadian) lighting solutions
- 4.3 Market Restraints
- 4.3.1 High upfront cost of quality LED luminaires
- 4.3.2 Thermal/voltage sensitivity in harsh environments
- 4.3.3 Influx of sub-standard low-cost imports
- 4.3.4 Supply-chain volatility after major vendor exits and M&A
- 4.4 Industry Value Chain Analysis
- 4.5 Impact of Macroeconomic Factors
- 4.6 Regulatory Landscape
- 4.7 Technological Outlook
- 4.8 Porter's Five Forces Analysis
- 4.8.1 Threat of New Entrants
- 4.8.2 Bargaining Power of Suppliers
- 4.8.3 Bargaining Power of Buyers
- 4.8.4 Threat of Substitutes
- 4.8.5 Competitive Rivalry
5 MARKET SIZE AND GROWTH FORECASTS (VALUE)
- 5.1 By Product Type
- 5.1.1 Lamps
- 5.1.2 Luminaires / Fixtures
- 5.2 By Distribution Channel
- 5.2.1 Direct Sales
- 5.2.2 Wholesale / Retail
- 5.2.3 E-commerce
- 5.3 By Installation Type
- 5.3.1 New Installation
- 5.3.2 Retrofit Installation
- 5.4 By Application
- 5.4.1 Commercial Offices
- 5.4.2 Retail Stores
- 5.4.3 Hospitality
- 5.4.4 Industrial
- 5.4.5 Highway and Roadway
- 5.4.6 Architectural
- 5.4.7 Public Places
- 5.4.8 Hospitals
- 5.4.9 Horticulture Gardens
- 5.4.10 Residential
- 5.4.11 Automotive
- 5.4.12 Others (Chemicals, Oil and Gas, Agriculture)
- 5.5 By End User
- 5.5.1 Indoor
- 5.5.2 Outdoor
- 5.5.3 Automotive
- 5.6 By Geography
- 5.6.1 North America
- 5.6.1.1 United States
- 5.6.1.2 Canada
- 5.6.1.3 Mexico
- 5.6.2 South America
- 5.6.2.1 Brazil
- 5.6.2.2 Argentina
- 5.6.2.3 Rest of South America
- 5.6.3 Europe
- 5.6.3.1 Germany
- 5.6.3.2 United Kingdom
- 5.6.3.3 France
- 5.6.3.4 Italy
- 5.6.3.5 Spain
- 5.6.3.6 Russia
- 5.6.3.7 Rest of Europe
- 5.6.4 Asia-Pacific
- 5.6.4.1 China
- 5.6.4.2 Japan
- 5.6.4.3 India
- 5.6.4.4 South Korea
- 5.6.4.4.1 UAE
- 5.6.4.5 South-East Asia
- 5.6.4.6 Rest of Asia-Pacific
- 5.6.5 Middle East and Africa
- 5.6.5.1 Middle East
- 5.6.5.1.1 Saudi Arabia
- 5.6.5.1.2 United Arab Emirates
- 5.6.5.1.3 Turkey
- 5.6.5.1.4 Rest of Middle East
- 5.6.5.2 Africa
- 5.6.5.2.1 South Africa
- 5.6.5.2.2 Nigeria
- 5.6.5.2.3 Rest of Africa
- 5.6.5.1 Middle East
- 5.6.1 North America
6 COMPETITIVE LANDSCAPE
- 6.1 Market Concentration
- 6.2 Strategic Moves
- 6.3 Market Share Analysis
- 6.4 Company Profiles (includes Global level Overview, Market level overview, Core Segments, Financials as available, Strategic Information, Market Rank/Share for key companies, Products and Services, and Recent Developments)
- 6.4.1 Signify N.V.
- 6.4.2 ams OSRAM AG
- 6.4.3 Acuity Brands Lighting Inc.
- 6.4.4 Cree LED (SMART Global Holdings)
- 6.4.5 LEDVANCE GmbH
- 6.4.6 Zumtobel Group AG
- 6.4.7 Nichia Corporation
- 6.4.8 Seoul Semiconductor Co. Ltd.
- 6.4.9 Everlight Electronics Co. Ltd.
- 6.4.10 Dialight plc
- 6.4.11 LSI Industries Inc.
- 6.4.12 Havells India Ltd.
- 6.4.13 Syska LED Lights Pvt. Ltd.
- 6.4.14 Opple Lighting Co. Ltd.
- 6.4.15 Yankon Group Co. Ltd.
- 6.4.16 Fagerhult Group
- 6.4.17 Current Lighting Solutions LLC
- 6.4.18 Leedarson Lighting Co. Ltd.
- 6.4.19 TOSPO Lighting Co. Ltd.
- 6.4.20 MLS Co. Ltd.
- 6.4.21 Hubbell Lighting Inc.
- 6.4.22 Panasonic Corporation (Lighting)
- 6.4.23 Bridgelux Inc.
- 6.4.24 Valmont Industries (Lighting)
7 MARKET OPPORTUNITIES AND FUTURE OUTLOOK
- 7.1 White-space and Unmet-Need Assessment

