
PUBLISHER: Mordor Intelligence | PRODUCT CODE: 1910557

PUBLISHER: Mordor Intelligence | PRODUCT CODE: 1910557
Enterprise Network Equipment - Market Share Analysis, Industry Trends & Statistics, Growth Forecasts (2026 - 2031)
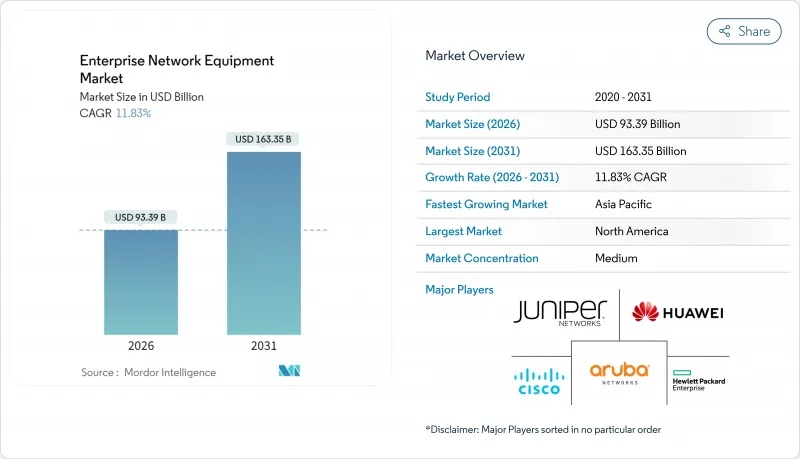
The enterprise network equipment market was valued at USD 83.51 billion in 2025 and estimated to grow from USD 93.39 billion in 2026 to reach USD 163.35 billion by 2031, at a CAGR of 11.83% during the forecast period (2026-2031).
This expansion stems from enterprise migration toward AI-optimized, cloud-managed infrastructure that favors software-defined control, bandwidth scalability, and automated operations over legacy hardware dependence. Strong demand for 400 G and 800 G switching inside data centers, urgent Wi-Fi 7 upgrades on campus networks, and rising SD-WAN roll-outs in branch sites all reinforce spending momentum. Supply-chain constraints for high-speed optical transceivers tighten inventory, giving vertically integrated vendors a pricing edge. In parallel, sustainability programs push low-power silicon that cuts the total cost of ownership by 15-20% during five-year cycles. Industry consolidation accelerates as platform vendors merge switching, security, and AI analytics into unified stacks.
Global Enterprise Network Equipment Market Trends and Insights
Surging Bandwidth Demand from IoT and Edge Computing
Edge architectures move processing close to data sources, multiplying traffic loads that older campus networks cannot support. Industrial IoT sites stream terabytes of sensor information that require 25 G or 100 G uplinks without latency penalties. Cisco's 2025 results showed 34% revenue growth in edge networking, fueled by manufacturing and logistics predictive-maintenance projects. Converged private 5G and Wi-Fi domains add hybrid device density, while computer-vision workloads consume 10-15 times traditional bandwidth, forcing east-west traffic design over north-south flows.
Rapid Enterprise-Wide Upgrades to Wi-Fi 7 Campus LANs
Wi-Fi 7 accelerates refresh cycles because wireless speed now drives productivity metrics. The IEEE 802.11be spec reaches 46 Gbps using 320 MHz channels, letting firms replace wired desktops with reliable wireless links. Arista recorded 27.6% campus switching growth in Q1 2025, with 60% tied to Wi-Fi 7 backhaul and PoE upgrades. High-density venues such as conference areas benefit from deterministic latency that supports AR in manufacturing and medical training.
High Maintenance and Compliance-Driven Security Costs
HIPAA, PCI DSS 4.0, and emerging AI laws force continuous monitoring, segmentation, and audit logging that raise operating expenses 20-30% of IT budgets. Financial firms deploy zero-trust overlays that need specialized appliances and expert services, lifting lifecycle costs above initial hardware spend.
Other drivers and restraints analyzed in the detailed report include:
- Cloud-Managed Networking and SD-WAN Adoption
- Government-Backed Smart-City Backbone Roll-Outs
- Ongoing Semiconductor Supply-Chain Constraints
For complete list of drivers and restraints, kindly check the Table Of Contents.
Segment Analysis
Switches captured 41.12% of the enterprise network equipment market in 2025, underscoring their centrality in campus and data-center topologies. The enterprise network equipment market size for switches is projected to rise with AI workloads that demand 400 G and 800 G fabrics offering line-rate, non-blocking performance. Wireless LAN remains the fastest mover at a 13.45% CAGR as Wi-Fi 7 enables high-density, low-latency mobility inside office, healthcare, and education environments. Routers maintain relevance in SD-WAN, while network-security appliances gain traction through micro-segmentation and behavior analytics.
Campus modernizations merge PoE upgrades with new multi-gigabit cabling to support power-hungry Wi-Fi 7 access points. Access controllers adopt cloud dashboards that automate channel assignment and threat mitigation. Edge switches integrate time-sensitive networking to carry industrial IoT traffic. Vendors enhance ASIC telemetry to give IT teams visibility down to buffer utilization, a capability vital for AI inference jitter control.
On-premises installations delivered 51.05% revenue in 2025, driven by data sovereignty rules among finance and government buyers. Still, cloud-managed adoption outpaces at 13.32% CAGR as organizations favor opex subscriptions and rapid rollout. The enterprise network equipment market share for cloud-managed platforms will widen as SMEs adopt plug-and-play Wi-Fi and SD-WAN solutions administered from multitenant portals.
Hybrid control gains fans in regulated industries that keep policy engines on-site while feeding analytics to the cloud. API-first design lets DevOps teams integrate network workflows into CI/CD pipelines. Consumption pricing smooths cash flows and lowers the barrier to branch expansion. Vendors differentiate through AI engines that predict faults and recommend remediation without manual ticketing.
The Enterprise Network Equipment Market Report is Segmented by Type (Switches, Routers, WLAN, and More), Deployment Model (On-Premises, Cloud-Managed, and Hybrid), Enterprise Size (Small and Medium Enterprises and Large Enterprises), End-User Vertical (IT and Telecom, BFSI, Healthcare, Manufacturing, and More), and Geography. The Market Forecasts are Provided in Terms of Value (USD).
Geography Analysis
North America retained 37.85% of 2025 revenue, fueled by early uptake of AI-centric fabrics and large hyperscale data-center footprints. Financial and healthcare regulations encourage rapid modernization with zero-trust overlays and campus Wi-Fi 7 adoption. The enterprise network equipment market size in the region benefits from strong capital budgets and a robust partner ecosystem.
Asia-Pacific shows the highest 13.54% CAGR through 2031. Chinese private 5G liberalization and Japanese digitization under Society 5.0 boost orders for wireless and edge equipment. Local procurement guidelines in China favor domestic switching suppliers, reshaping vendor share. India's cloud boom magnifies SME demand for cloud-managed SD-WAN and Wi-Fi.
Europe posts steady growth anchored in GDPR compliance, digital sovereignty, and green-tech directives. German Industry 4.0 programs drive deterministic Ethernet adoption, while Nordic sustainability rules reward low-power silicon. Middle East and Africa secure smart-city funding that installs fiber backbones and metro Wi-Fi, though macro volatility tempers spending. South America invests in 5G backhaul and municipal broadband, but currency fluctuations influence deal timing.
- Cisco Systems Inc.
- Huawei Technologies Co. Ltd.
- Hewlett Packard Enterprise Company
- Aruba Networks LLC
- Juniper Networks Inc.
- Arista Networks Inc.
- Extreme Networks Inc.
- Dell Technologies Inc.
- Broadcom Inc.
- Fortinet Inc.
- Palo Alto Networks Inc.
- Check Point Software Technologies Ltd.
- F5 Inc.
- VMware LLC
- New H3C Technologies Co. Ltd.
- Nokia Corporation
- ZTE Corporation
- Ubiquiti Inc.
- Alcatel-Lucent Enterprise
- NETSCOUT Systems Inc.
- A10 Networks Inc.
- TP-Link Technologies Co. Ltd.
Additional Benefits:
- The market estimate (ME) sheet in Excel format
- 3 months of analyst support
TABLE OF CONTENTS
1 INTRODUCTION
- 1.1 Study Assumptions and Market Definition
- 1.2 Scope of the Study
2 RESEARCH METHODOLOGY
3 EXECUTIVE SUMMARY
4 MARKET LANDSCAPE
- 4.1 Market Overview
- 4.2 Market Drivers
- 4.2.1 Surging bandwidth demand from IoT and edge computing
- 4.2.2 Rapid enterprise-wide upgrades to Wi-Fi 7 campus LANs
- 4.2.3 Cloud-managed networking and SD-WAN adoption
- 4.2.4 Government-backed smart-city backbone roll-outs
- 4.2.5 AI-driven need for 400/800 G switches in enterprise data centers
- 4.2.6 Sustainability mandates pushing low-power switching silicon
- 4.3 Market Restraints
- 4.3.1 High maintenance and compliance-driven security costs
- 4.3.2 Ongoing semiconductor supply-chain constraints
- 4.3.3 Shortage of skilled engineers for software-defined networks
- 4.3.4 Pandemic-era inventory overhang delaying refresh cycles
- 4.4 Industry Value Chain Analysis
- 4.5 Impact of Macroeconomic Factors
- 4.6 Regulatory Landscape
- 4.7 Technological Outlook
- 4.8 Porter's Five Forces Analysis
- 4.8.1 Bargaining Power of Suppliers
- 4.8.2 Bargaining Power of Consumers
- 4.8.3 Threat of New Entrants
- 4.8.4 Threat of Substitutes
- 4.8.5 Intensity of Competitive Rivalry
5 MARKET SIZE AND GROWTH FORECASTS (VALUES)
- 5.1 By Type
- 5.1.1 Switches
- 5.1.2 Routers
- 5.1.3 WLAN
- 5.1.4 Network Security
- 5.1.5 Access Points and Controllers
- 5.2 By Deployment Model
- 5.2.1 On-Premises
- 5.2.2 Cloud-Managed
- 5.2.3 Hybrid
- 5.3 By Enterprise Size
- 5.3.1 Small and Medium Enterprises
- 5.3.2 Large Enterprises
- 5.4 By End-User Vertical
- 5.4.1 IT and Telecom
- 5.4.2 BFSI
- 5.4.3 Healthcare
- 5.4.4 Manufacturing
- 5.4.5 Government
- 5.4.6 Retail and E-commerce
- 5.4.7 Other End-User Verticals
- 5.5 By Geography
- 5.5.1 North America
- 5.5.1.1 United States
- 5.5.1.2 Canada
- 5.5.1.3 Mexico
- 5.5.2 South America
- 5.5.2.1 Brazil
- 5.5.2.2 Argentina
- 5.5.2.3 Chile
- 5.5.2.4 Rest of South America
- 5.5.3 Europe
- 5.5.3.1 Germany
- 5.5.3.2 United Kingdom
- 5.5.3.3 France
- 5.5.3.4 Italy
- 5.5.3.5 Spain
- 5.5.3.6 Rest of Europe
- 5.5.4 Asia-Pacific
- 5.5.4.1 China
- 5.5.4.2 Japan
- 5.5.4.3 South Korea
- 5.5.4.4 India
- 5.5.4.5 Singapore
- 5.5.4.6 Australia
- 5.5.4.7 Rest of Asia-Pacific
- 5.5.5 Middle East and Africa
- 5.5.5.1 Middle East
- 5.5.5.1.1 Saudi Arabia
- 5.5.5.1.2 United Arab Emirates
- 5.5.5.1.3 Turkey
- 5.5.5.1.4 Rest of Middle East
- 5.5.5.2 Africa
- 5.5.5.2.1 South Africa
- 5.5.5.2.2 Nigeria
- 5.5.5.2.3 Egypt
- 5.5.5.2.4 Rest of Africa
- 5.5.5.1 Middle East
- 5.5.1 North America
6 COMPETITIVE LANDSCAPE
- 6.1 Market Concentration
- 6.2 Strategic Moves
- 6.3 Market Share Analysis
- 6.4 Company Profiles (includes Global level Overview, Market level overview, Core Segments, Financials as available, Strategic Information, Market Rank/Share for key companies, Products and Services, and Recent Developments)
- 6.4.1 Cisco Systems Inc.
- 6.4.2 Huawei Technologies Co. Ltd.
- 6.4.3 Hewlett Packard Enterprise Company
- 6.4.4 Aruba Networks LLC
- 6.4.5 Juniper Networks Inc.
- 6.4.6 Arista Networks Inc.
- 6.4.7 Extreme Networks Inc.
- 6.4.8 Dell Technologies Inc.
- 6.4.9 Broadcom Inc.
- 6.4.10 Fortinet Inc.
- 6.4.11 Palo Alto Networks Inc.
- 6.4.12 Check Point Software Technologies Ltd.
- 6.4.13 F5 Inc.
- 6.4.14 VMware LLC
- 6.4.15 New H3C Technologies Co. Ltd.
- 6.4.16 Nokia Corporation
- 6.4.17 ZTE Corporation
- 6.4.18 Ubiquiti Inc.
- 6.4.19 Alcatel-Lucent Enterprise
- 6.4.20 NETSCOUT Systems Inc.
- 6.4.21 A10 Networks Inc.
- 6.4.22 TP-Link Technologies Co. Ltd.
7 MARKET OPPORTUNITIES AND FUTURE OUTLOOK
- 7.1 White-space and Unmet-need Assessment

