
PUBLISHER: Mordor Intelligence | PRODUCT CODE: 1910606

PUBLISHER: Mordor Intelligence | PRODUCT CODE: 1910606
Hardware-as-a-Service (HaaS) - Market Share Analysis, Industry Trends & Statistics, Growth Forecasts (2026 - 2031)
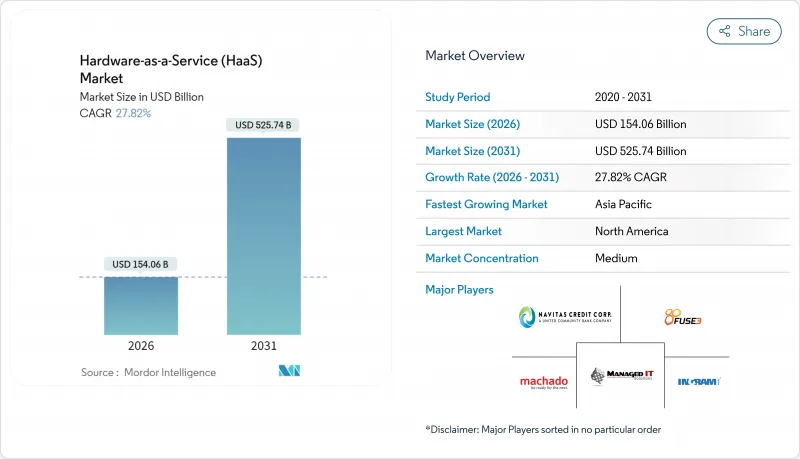
The hardware as a service market was valued at USD 120.54 billion in 2025 and estimated to grow from USD 154.06 billion in 2026 to reach USD 525.74 billion by 2031, at a CAGR of 27.82% during the forecast period (2026-2031).
The leap reflects enterprises converting capital-intensive hardware purchases into predictable subscriptions, a shift accelerated by hybrid-work security mandates and CFO preference for operating-expense flexibility. Sovereign AI programs, such as Canada's CAD 1.7 billion allocation for domestic super-computing, are stimulating home-grown infrastructure demand, while the U.S. CHIPS and Science Act's USD 50 billion incentives are pushing manufacturers toward subscription robotics to modernize plants without depleting cash reserves. Asset-backed securitization is scaling the hardware as a service market, with DLL issuing USD 2.15 billion in notes during 2024, lowering providers' cost of funds and enabling competitive pricing. Circular-economy regulation in the EU is another catalyst because the model aligns with mandated durability and repairability standards.
Global Hardware-as-a-Service (HaaS) Market Trends and Insights
Enterprises shift CapEx to OpEx with subscriptions
Leasing overtook purchasing for 54% of U.S. equipment acquisitions in 2024, illustrating the pivot to operational expenses Subscription contracts free capital for strategic projects and shield buyers from rapid depreciation. Dell APEX customers report a 50% cut in help-desk load and 30% lower support costs, showing that outcome-oriented partnerships replace one-off sales. The benefit is amplified in sectors with fast obsolescence, making the hardware-as-a-service market a strategic hedge against technology risk.
Device lifecycle shortens under hybrid-work security rules
Distributed work raises endpoint threat exposure, compressing refresh cycles below four years. HP introduced quantum-resistant firmware to counter future decryption risks, underscoring the security premium now baked into device turnover [HP.COM]. Seventy percent of SMEs plan permanent remote-work policies that intensify the need for managed refresh services.
Limited SME awareness of HaaS total-cost benefits
OECD notes that digital gaps linger because SMEs lack the financing skills and staff capacity to evaluate subscription proposals. The mismatch slows adoption in cost-sensitive regions, though provider-run assessment tools and government grants are shrinking the knowledge gap.
Other drivers and restraints analyzed in the detailed report include:
- VC funding and securitization boost industrial HaaS
- Government on-shoring incentives accelerate automation
- Vendor lock-in and complex exit terms
For complete list of drivers and restraints, kindly check the Table Of Contents.
Segment Analysis
Device-as-a-Service captured 31.74 of of % hardware as a service market share in 2025. Robot-as-a-Service, however, posts the fastest 29.35% CAGR, powered by small-factory automation and cheaper collaborative robots. The hardware as a service market size for GPU-as-a-Service is scaling alongside AI workloads; GPU subscriptions grew from USD 4.31 billion in 2025 to projections of USD 49.84 billion by 2031. Professional services wrap these hardware offerings with deployment, monitoring, and optimization that enhance uptime.
Subscription innovation extends to platform-level services. Siemens Senseye processes more than 1 million sensor points per minute, showing how predictive analytics converts raw hardware into industrial performance guarantees. The architecture shift elevates value from ownership to usage, anchoring the hardware as a service market in outcome-based economics and tilting competitive advantage toward vendors that bundle analytics and financing expertise.
On-premises deployments held a 44.85% share in 2025, a testament to compliance and latency sensitivities in industries such as finance and healthcare. Yet the hybrid/network-as-a-service model grows at 25.9% CAGR because it fuses local control with cloud elasticity. Lenovo's ThinkAgile MX455 V3 lets customers place AI inference at the edge while bursting training workloads to Azure, demonstrating how workload portability defines modern procurement.
Cloud-managed hardware services remain crucial for burst capacity and simplified updates, but data sovereignty law keeps certain workloads local. IBM's Power Virtual Server on-premise pod shows that even public-cloud vendors are packaging localized subscriptions to satisfy sovereignty mandates. The hardware as a service market is therefore shifting from an either-or mindset to a continuum where assets can relocate dynamically.
The Hardware As A Service Market Report is Segmented by Offering (Device-As-A-Service, Desktop/PC-as-a-Service, and More), Deployment Mode (On-Premises, Cloud-Managed, Hybrid/Network-as-a-Service), End-User Enterprise Size (Large Enterprises, Smes), End-User Industry (Retail and Wholesale, Education, and More), and Geography. The Market Forecasts are Provided in Terms of Value (USD).
Geography Analysis
North America retained a 41.72% share of the hardware as a service market in 2025, sustained by sophisticated leasing ecosystems and federal incentives that reward domestic production. Over half of U.S. equipment procurement already flows through leases, reinforcing subscription maturity. Government grants supporting semiconductor and advanced manufacturing multiply demand for flexible robotics and edge devices.
Asia-Pacific is the fastest-growing region, posting a 19.15% CAGR. China's equipment renewal plan that aims for 25% growth in capital goods spending by 2027, and India's data-center expansion to support digital payments, will generate robust subscription pipelines. Taiwan's dominance in server manufacturing supplies the global logistics chain for device-as-a-service fleets, further entwining the region with global hardware as a service market expansion
Europe's trajectory hinges on circular-economy regulations that push organizations toward service-based ownership. The Ecodesign for Sustainable Products Regulation effective July 2024 requires long life, repairability, and spare-parts availability, aligning directly with service contracts that embed maintenance. Providers adept at managing take-back loops and refurbishment enjoy regulatory tailwinds, marking Europe as a laboratory for sustainability-driven subscription innovation.
- Dell Technologies Inc.
- HP Inc.
- Lenovo Group Limited
- Fujitsu Limited
- Microsoft Corporation
- Cisco Systems, Inc.
- Amazon.com, Inc. (AWS Devices & Services)
- Hewlett Packard Enterprise Company
- Arrow Electronics, Inc.
- Ingram Micro Inc.
- Navitas Credit Corp.
- PhoenixNAP, LLC
- FUSE3 Communications, LLC
- Design Data Systems, Inc.
- Machado Consulting, Inc.
- Managed IT Solutions, Inc.
- Formic Technologies, Inc.
- Flex Ltd.
- Zscaler, Inc.
- Google LLC (ChromeOS & DaaS alliances)
Additional Benefits:
- The market estimate (ME) sheet in Excel format
- 3 months of analyst support
TABLE OF CONTENTS
1 Global Hardware-as-a-Service (HaaS) Market
2 INTRODUCTION
- 2.1 Study Assumptions and Market Definition
- 2.2 Scope of the Study
3 RESEARCH METHODOLOGY
4 EXECUTIVE SUMMARY
5 MARKET LANDSCAPE
- 5.1 Market Overview
- 5.2 Market Drivers
- 5.2.1 Enterprises shifting CapEx to OpEx through subscription-based hardware procurement
- 5.2.2 Device lifecycle shortening under hybrid-work security mandates
- 5.2.3 Rising VC funding and asset-backed securitisation models for industrial HaaS
- 5.2.4 Government on-shoring incentives accelerating automation via HaaS
- 5.2.5 Circular-economy regulations favouring product-as-a-service
- 5.2.6 Embedded IoT-analytics enabling predictive-maintenance contracts
- 5.3 Market Restraints
- 5.3.1 Limited SME awareness of HaaS total-cost benefits
- 5.3.2 Vendor lock-in and complex exit terms
- 5.3.3 Rising cost of capital compressing provider margins
- 5.3.4 Non-uniform accounting rules for subscription hardware assets
- 5.4 Industry Value / Supply-Chain Analysis
- 5.5 Regulatory Landscape
- 5.6 Technological Outlook
- 5.7 Porter's Five Forces Analysis
- 5.7.1 Bargaining Power of Suppliers
- 5.7.2 Bargaining Power of Consumers
- 5.7.3 Threat of New Entrants
- 5.7.4 Threat of Substitutes
- 5.7.5 Intensity of Competitive Rivalry
6 MARKET SIZE AND GROWTH FORECASTS (VALUE)
- 6.1 By Offering
- 6.1.1 Hardware Model
- 6.1.1.1 Device-as-a-Service (DaaS)
- 6.1.1.2 Desktop/PC-as-a-Service
- 6.1.1.3 Infrastructure-Hardware-as-a-Service (I-HaaS)
- 6.1.1.4 Platform-Hardware-as-a-Service (P-HaaS)
- 6.1.1.5 Robot-as-a-Service (RaaS)
- 6.1.1.6 GPU-as-a-Service (GPUaaS)
- 6.1.2 Professional Services
- 6.1.1 Hardware Model
- 6.2 By Deployment Mode
- 6.2.1 On-premises
- 6.2.2 Cloud-managed
- 6.2.3 Hybrid / Network-as-a-Service
- 6.3 By End-user Enterprise Size
- 6.3.1 Large Enterprises
- 6.3.2 SMEs
- 6.4 By End-User Industry
- 6.4.1 Retail and Wholesale
- 6.4.2 Education
- 6.4.3 Banking, Financial Services and Insurance (BFSI)
- 6.4.4 Manufacturing
- 6.4.5 Healthcare and Life Sciences
- 6.4.6 IT and Telecommunications
- 6.4.7 Government and Public Sector
- 6.4.8 Other Industries (Energy, Construction, etc.)
- 6.5 By Geography
- 6.5.1 North America
- 6.5.1.1 United States
- 6.5.1.2 Canada
- 6.5.1.3 Mexico
- 6.5.2 Europe
- 6.5.2.1 Germany
- 6.5.2.2 United Kingdom
- 6.5.2.3 France
- 6.5.2.4 Russia
- 6.5.2.5 Rest of Europe
- 6.5.3 Asia-Pacific
- 6.5.3.1 China
- 6.5.3.2 Japan
- 6.5.3.3 India
- 6.5.3.4 South Korea
- 6.5.3.5 Australia
- 6.5.3.6 Rest of Asia-Pacific
- 6.5.4 Middle East and Africa
- 6.5.4.1 Middle East
- 6.5.4.1.1 Saudi Arabia
- 6.5.4.1.2 United Arab Emirates
- 6.5.4.1.3 Rest of Middle East
- 6.5.4.2 Africa
- 6.5.4.2.1 South Africa
- 6.5.4.2.2 Egypt
- 6.5.4.2.3 Rest of Africa
- 6.5.4.1 Middle East
- 6.5.5 South America
- 6.5.5.1 Brazil
- 6.5.5.2 Argentina
- 6.5.5.3 Rest of South America
- 6.5.1 North America
7 COMPETITIVE LANDSCAPE
- 7.1 Market Concentration
- 7.2 Strategic Moves
- 7.3 Market Share Analysis
- 7.4 Company Profiles (includes Global level Overview, Market level overview, Core Segments, Financials as available, Strategic Information, Market Rank/Share for key companies, Products and Services, and Recent Developments)
- 7.4.1 Dell Technologies Inc.
- 7.4.2 HP Inc.
- 7.4.3 Lenovo Group Limited
- 7.4.4 Fujitsu Limited
- 7.4.5 Microsoft Corporation
- 7.4.6 Cisco Systems, Inc.
- 7.4.7 Amazon.com, Inc. (AWS Devices & Services)
- 7.4.8 Hewlett Packard Enterprise Company
- 7.4.9 Arrow Electronics, Inc.
- 7.4.10 Ingram Micro Inc.
- 7.4.11 Navitas Credit Corp.
- 7.4.12 PhoenixNAP, LLC
- 7.4.13 FUSE3 Communications, LLC
- 7.4.14 Design Data Systems, Inc.
- 7.4.15 Machado Consulting, Inc.
- 7.4.16 Managed IT Solutions, Inc.
- 7.4.17 Formic Technologies, Inc.
- 7.4.18 Flex Ltd.
- 7.4.19 Zscaler, Inc.
- 7.4.20 Google LLC (ChromeOS & DaaS alliances)
8 MARKET OPPORTUNITIES AND FUTURE TRENDS
- 8.1 White-space and Unmet-need Assessment

