
PUBLISHER: Mordor Intelligence | PRODUCT CODE: 1910676

PUBLISHER: Mordor Intelligence | PRODUCT CODE: 1910676
Power Transformer - Market Share Analysis, Industry Trends & Statistics, Growth Forecasts (2026 - 2031)
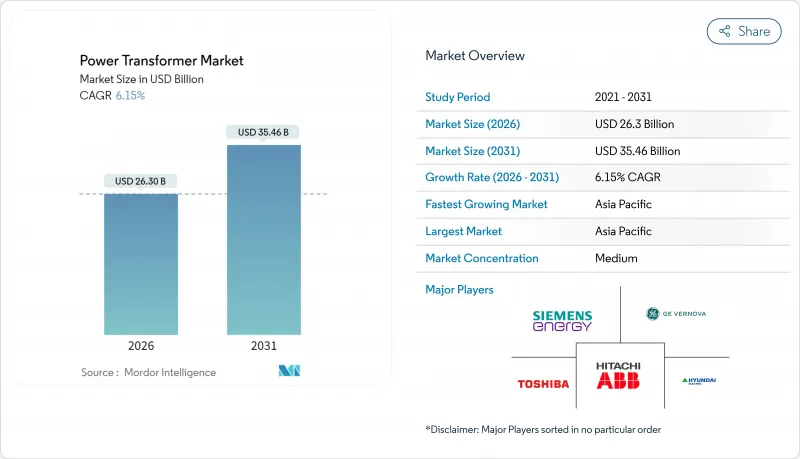
The Power Transformer Market was valued at USD 24.78 billion in 2025 and estimated to grow from USD 26.3 billion in 2026 to reach USD 35.46 billion by 2031, at a CAGR of 6.15% during the forecast period (2026-2031).
This momentum reflects industrial electrification programs, large-scale renewable interconnections, and grid-hardening mandates that together channel record capital toward high-voltage equipment. As procurement teams chase supply security, factory backlogs longer than two years have turned delivery reliability into the top buying criterion. Utilities, independent power producers, and hyperscale data-center operators are locking multi-year offtake agreements that effectively pre-sell transformer capacity well before steel is ordered. The Asia-Pacific region anchors both supply and demand, yet nearshoring drives parallel capacity build-outs in North America and Europe, aimed at shortening transit times and mitigating geopolitical risks. Collectively, these forces are redefining product specifications, service models, and margin opportunities throughout the power transformer market.
Global Power Transformer Market Trends and Insights
Increasing Integration of Renewable Energy Generation
Wind and solar build-outs require transformers capable of regulating voltage swings of up to 80% within minutes while accommodating bidirectional power flow. The International Energy Agency expects renewable capacity to more than double by 2030, translating into thousands of grid-tied step-up units equipped with on-load tap changers and dynamic harmonic filters. Solid-state and hybrid topologies are progressing from prototypes to limited-series production as utilities demand lighter footprints and instant voltage support. Manufacturers respond with modular cores that ship in segments, assemble on-site, and flex across 132 kV to 400 kV ratings without requiring new design cycles. Digital twin models embedded at the point of order enable asset owners to simulate thermal margins before a single lamination is cut, thereby reducing the risk associated with the acceptance of next-generation architectures.
Aging Power Grids & Heavy T&D Refurbishment Pipelines
More than 70% of large power transformers in North America have operated for over 25 years, resulting in a surge of replacement orders that exceeds current nameplate capacity. Europe faces a parallel cliff as post-war equipment nears simultaneous end-of-life. The National Renewable Energy Laboratory projects that distribution-level demand could rise 260% by 2050 under deep electrification scenarios. Utilities utilize dissolved-gas analytics, acoustic-emission sensors, and infrared scans to triage fleets; yet, many units still succumb to insulation breakdown after decades of exposure to overload conditions. Refurbishment specialists now re-core tanks onsite, trimming lead time by two-thirds and reducing carbon footprints compared to full replacement. Even so, deferred investment increases the risk of failure, thereby reinforcing the baseline demand for new power transformers market.
High CAPEX & Multi-Year Payback Periods
Transformer prices have escalated up to 80% since 2020, inflating capital budgets and pushing simple-payback horizons well beyond five years. Utilities counter by bundling financing through lease-leaseback and energy-as-a-service agreements that move assets off balance sheets. Federal lobbying seeks USD 1.2 billion in support for domestic core-steel supply to ease cost spikes in the power transformer market. Meanwhile, condition-based maintenance, utilizing gas-in-oil sensors and bushing-mounted temperature probes, extends lifetimes but adds operational complexity and increases cybersecurity exposure.
Other drivers and restraints analyzed in the detailed report include:
- Stricter Grid-Reliability Standards & HVDC Interconnections
- Electrification of Rail & E-Bus Networks
- Volatile Prices of Grain-Oriented Electrical Steel & Copper
For complete list of drivers and restraints, kindly check the Table Of Contents.
Segment Analysis
Large transformers above 100 MVA are booked at the quickest 7.28% CAGR to 2031, as utilities consolidate multiple air-insulated substations into single high-capacity yards designed around 400 kV and 765 kV corridors. The power transformer market size attributed to this rating tier is set to exceed USD 12.47 billion by the end of the decade, accounting for more than one-third of the total value. Utilities pursue large units for higher efficiency per MVA and simplified maintenance scheduling, trading up-front capital for lifetime loss savings.
Medium transformers maintained a 51.87% share in 2025, thanks to standardization, easier logistics, and shorter factory cycles. Yet medium-class lead times have also stretched as plants retool bays for larger cores, partially constraining volumes. Small ratings below 10 MVA remain essential in distribution networks, especially in rural electrification schemes across the Asia-Pacific region, where density and topography restrict substation footprints. Overall, the power transformer market continues to balance versatile medium units against momentum toward mega-capacity solutions.
Oil-cooled designs dominated the market with an 80.68% share in 2025, as mineral oil delivers unmatched thermal headroom at a compelling cost per kilowatt of dissipation. Nevertheless, strict fire-safety codes in dense metropolitan nodes propel air-cooled growth at 7.35% yearly, a clip two points above the overall power transformer market. Synthetic ester fluids offer a middle ground, elevating flash points to 300 °C and achieving biodegradability targets; however, price premiums slow universal adoption.
Air-cooled models utilize forced-ventilation plenums and finned heat-sink geometry to minimize loss differentials compared to oil systems. They dominate data-center utility interface bays where insurers discount premiums for non-flammable coolant. Suppliers now deliver plug-and-play air-coolers with modular fan trays that slide out for field swaps, aligning with hyperscale maintenance windows that tolerate only minutes of downtime.
The Power Transformer Market Report is Segmented by Power Rating (Large, Medium, and Small), Cooling Type (Air-Cooled and Oil-Cooled), Phase (Single-Phase and Three-Phase), End-User (Power Utilities, Industrial, Commercial, and Residential), and Geography (North America, Europe, Asia-Pacific, South America, and Middle East and Africa). The Market Sizes and Forecasts are Provided in Terms of Value (USD).
Geography Analysis
The Asia-Pacific region led the power transformer market with a 41.88% share in 2025 and is projected to grow at a 6.73% CAGR to 2031. China's vertically integrated supply chain compresses cost curves and anchors export volumes, though some overseas buyers diversify into Indian and Vietnamese plants to dilute geopolitical exposure. India's Production-Linked Incentive scheme underwrites new coil-winding and tank-fabrication workshops, while its rural electrification targets accelerate orders for both grid and distribution units. Japan and South Korea focus on premium designs, 5-leg cores, and amorphous materials, which are exported to solvent-based North American utilities.
North America is a mature but supply-constrained market where federal tax credits and funding pools help offset the capital penalties associated with domestic builds. Projects such as the Plains & Eastern HVDC line demand converter transformers that only three local factories can presently fabricate, a gap now addressed by joint ventures with overseas OEMs. Canada modernizes hydro-linked interties to the United States, while Mexico attracts near-shore electronics plants that stretch industrial substation demand.
Europe balances renewable penetration and aging fleet replacement. Germany's Energiewende drives 400 kV network re-routing to coastal wind hubs, while France upgrades 225 kV corridors feeding nuclear retrofits. Scandinavian markets are adopting SF6-free gas insulation at a rapid pace due to strict F-gas rules, incentivizing early-mover OEMs to be fluent in GWP-neutral alternatives. Eastern Europe leverages EU cohesion funds for grid upgrades that eject Soviet-era oil-paper relics, creating fresh demand in the power transformer market.
- Hitachi Energy (ABB)
- Siemens Energy AG
- GE Vernova
- Toshiba Energy Systems & Solutions
- Hyundai Electric & Energy Systems
- Mitsubishi Electric Corporation
- Hyosung Heavy Industries
- Bharat Heavy Electricals Limited
- CG Power & Industrial Solutions
- SPX Transformer Solutions
- TBEA Co. Ltd.
- JiangSu HuaPeng Transformer
- Shandong Taikai Transformer
- Schneider Electric
- Eaton Corporation
- Fuji Electric
- LS Electric
- WEG SA
- Wilson Transformer Company
- Saudi Transformers Co.
- Elsewedy Electric
- Hammond Power Solutions
- TriDelta Meidensha
Additional Benefits:
- The market estimate (ME) sheet in Excel format
- 3 months of analyst support
TABLE OF CONTENTS
1 Introduction
- 1.1 Study Assumptions & Market Definition
- 1.2 Scope of the Study
2 Research Methodology
3 Executive Summary
4 Market Landscape
- 4.1 Market Overview
- 4.2 Market Drivers
- 4.2.1 Increasing integration of renewable energy generation
- 4.2.2 Aging power grids & heavy T&D refurbishment pipelines
- 4.2.3 Stricter grid-reliability standards & HVDC interconnections
- 4.2.4 Electrification of rail & e-bus networks
- 4.2.5 Data-centre ultra-HV demand for flexible-core LPTs
- 4.2.6 Green-hydrogen electrolysers? step-up transformer needs
- 4.3 Market Restraints
- 4.3.1 High CAPEX & multi-year payback periods
- 4.3.2 Volatile prices of grain-oriented electrical steel & copper
- 4.3.3 Geopolitical trade curbs on critical transformer components
- 4.3.4 Global shortage of experienced transformer-design engineers
- 4.4 Supply-Chain Analysis
- 4.5 Regulatory Landscape
- 4.6 Technological Outlook
- 4.7 Porter's Five Forces
- 4.7.1 Bargaining Power of Suppliers
- 4.7.2 Bargaining Power of Buyers
- 4.7.3 Threat of New Entrants
- 4.7.4 Threat of Substitutes
- 4.7.5 Intensity of Competitive Rivalry
5 Market Size & Growth Forecasts
- 5.1 By Power Rating (MVA)
- 5.1.1 Large (Above 100 MVA)
- 5.1.2 Medium (10 to 100 MVA)
- 5.1.3 Small (Up to 10 MVA)
- 5.2 By Cooling Type
- 5.2.1 Air-cooled
- 5.2.2 Oil-cooled
- 5.3 By Phase
- 5.3.1 Single-Phase
- 5.3.2 Three-Phase
- 5.4 By End-User
- 5.4.1 Power Utilities (includes, Renewables, Non-renewables, and T&D)
- 5.4.2 Industrial
- 5.4.3 Commercial
- 5.4.4 Residential
- 5.5 By Region
- 5.5.1 North America
- 5.5.1.1 United States
- 5.5.1.2 Canada
- 5.5.1.3 Mexico
- 5.5.2 Europe
- 5.5.2.1 Germany
- 5.5.2.2 United Kingdom
- 5.5.2.3 France
- 5.5.2.4 Italy
- 5.5.2.5 Spain
- 5.5.2.6 Russia
- 5.5.2.7 Rest of Europe
- 5.5.3 Asia-Pacific
- 5.5.3.1 China
- 5.5.3.2 India
- 5.5.3.3 Japan
- 5.5.3.4 South Korea
- 5.5.3.5 ASEAN Countries
- 5.5.3.6 Australia and New Zealand
- 5.5.3.7 Rest of Asia-Pacific
- 5.5.4 South America
- 5.5.4.1 Brazil
- 5.5.4.2 Argentina
- 5.5.4.3 Chile
- 5.5.4.4 Rest of South America
- 5.5.5 Middle East and Africa
- 5.5.5.1 Saudi Arabia
- 5.5.5.2 United Arab Emirates
- 5.5.5.3 South Africa
- 5.5.5.4 Egypt
- 5.5.5.5 Rest of Middle East and Africa
- 5.5.1 North America
6 Competitive Landscape
- 6.1 Market Concentration
- 6.2 Strategic Moves (M&A, Partnerships, PPAs)
- 6.3 Market Share Analysis (Market Rank/Share for key companies)
- 6.4 Company Profiles (includes Global level Overview, Market level overview, Core Segments, Financials as available, Strategic Information, Products & Services, and Recent Developments)
- 6.4.1 Hitachi Energy (ABB)
- 6.4.2 Siemens Energy AG
- 6.4.3 GE Vernova
- 6.4.4 Toshiba Energy Systems & Solutions
- 6.4.5 Hyundai Electric & Energy Systems
- 6.4.6 Mitsubishi Electric Corporation
- 6.4.7 Hyosung Heavy Industries
- 6.4.8 Bharat Heavy Electricals Limited
- 6.4.9 CG Power & Industrial Solutions
- 6.4.10 SPX Transformer Solutions
- 6.4.11 TBEA Co. Ltd.
- 6.4.12 JiangSu HuaPeng Transformer
- 6.4.13 Shandong Taikai Transformer
- 6.4.14 Schneider Electric
- 6.4.15 Eaton Corporation
- 6.4.16 Fuji Electric
- 6.4.17 LS Electric
- 6.4.18 WEG SA
- 6.4.19 Wilson Transformer Company
- 6.4.20 Saudi Transformers Co.
- 6.4.21 Elsewedy Electric
- 6.4.22 Hammond Power Solutions
- 6.4.23 TriDelta Meidensha
7 Market Opportunities & Future Outlook
- 7.1 White-space & Unmet-Need Assessment

