
PUBLISHER: Mordor Intelligence | PRODUCT CODE: 1910691

PUBLISHER: Mordor Intelligence | PRODUCT CODE: 1910691
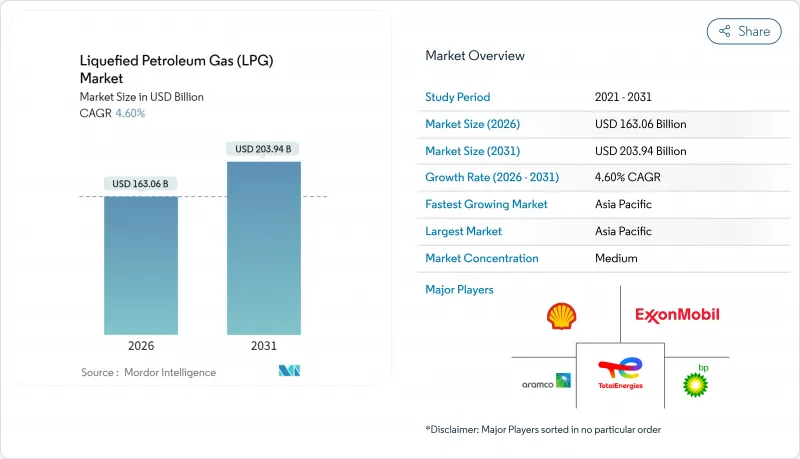
Liquefied Petroleum Gas (LPG) - Market Share Analysis, Industry Trends & Statistics, Growth Forecasts (2026 - 2031)
The Liquefied Petroleum Gas Market was valued at USD 155.89 billion in 2025 and estimated to grow from USD 163.06 billion in 2026 to reach USD 203.94 billion by 2031, at a CAGR of 4.60% during the forecast period (2026-2031).
Demand resilience is anchored by Asian petrochemical feedstock growth, large-scale rural cooking programs in India and Indonesia, and continuing substitution of high-sulfur fuels after IMO-2020 upgrades. Supply diversity widens as Qatar and the UAE lift output while North American producers maximize shale-derived volumes, yet export bottlenecks keep price swings frequent. Bio-LPG gains momentum under EU decarbonization rules, and pipeline investments in India, the United States, and West Africa seek to trim logistics costs and safety risks. Market participants, therefore, juggle a balanced opportunity set: stable household consumption, expanding petrochemical pull, and regulatory shifts that reward lower-carbon molecules.
Global Liquefied Petroleum Gas (LPG) Market Trends and Insights
LPG-ready cook-stove programmes expand clean fuel access
Indonesia's conversion of 50 million households from kerosene to LPG demonstrates rapid scalability and has become a reference model for other developing nations. India's Pradhan Mantri Ujjwala Yojana added 7.5 million new cylinder connections in 2024, driving a 24% import surge despite ongoing subsidy rationalization. West African governments now partner with the World Bank's Global LPG Partnership to replicate these roll-outs, aiming to lift Cameroon's penetration from 12% to 58% by 2030. Persistent rural electrification gaps leave LPG competitively positioned versus electric cooking, particularly where grid reliability remains low. Therefore, continued subsidy targeting and last-mile distribution innovation are central to sustaining household uptake.
Petrochemical feedstock demand boom reshapes Asian trade flows
China's propane dehydrogenation capacity climbed to 22.6 million t/y in 2024 and underpins steady seaborne imports despite cyclical economic slowdowns. India followed by committing USD 8 billion to a 1.5 million t/y ethane cracker at Vadinar that secures domestic feedstock and curbs foreign dependency. US ethane exports to China are projected to rise another 9-34% in 2025 as lower tariffs improve arbitrage economics. Tightening propylene balances have driven US polymer-grade prices beyond USD 0.40 per pound after LyondellBasell shuttered refinery units. In aggregate, more than USD 16 billion of Asian pipeline and storage infrastructure is set to anchor long-run liquefied petroleum gas market growth by absorbing regional demand volatility.
Price volatility driven by US export constraints
Gulf Coast terminal utilization hovered near 100% in 2024, sending Mont Belvieu cargo premiums to 32.5 c/gal before retreating when surplus propane hit storage. Enterprise's 300,000 b/d Houston expansion will not materialize until late 2026, while the 400,000 b/d ONEOK-MPLX Texas City project arrives only in 2028, leaving an interim capacity crunch. With the United States exporting 70% of its 2.13 million b/d propane output, any arbitrage closure triggers rapid inventory builds and price instability. China's position as the largest buyer magnifies geopolitical risk: a renewed tariff dispute could force Asian importers toward higher-priced Middle Eastern cargos. Volatility encourages heavier use of paper hedging, evidenced by a 43% surge in ethane and propane derivative trading volumes during 2024.
Other drivers and restraints analyzed in the detailed report include:
- Refinery upgrades for IMO-2020 multiply LPG supply points
- Renewable propane scale-up introduces low-carbon competition
- Induction cooking erodes urban LPG demand pockets
For complete list of drivers and restraints, kindly check the Table Of Contents.
Segment Analysis
Natural-gas liquids secured a 60.45% share of the liquefied petroleum gas market in 2025, buoyed by North American shale and Middle Eastern associated-gas projects that keep marginal costs low. Qatar's North Field build-out will elevate national LPG output from 10.7 million t in 2024 to 17.6 million t by 2030, while three ADNOC Gas programs add 2.5 million t over the same horizon, strengthening regional supply security. Refinery-derived LPG has come under pressure as Indian and Chinese refiners pivot toward petrochemicals, trimming run rates for fuels blending streams. Although still modest, the liquefied petroleum gas market size for bio-LPG is anticipated to expand at a 14.58% CAGR when measured from its 2025 baseline as EU mandates and state incentives unlock new production capacity. The segment benefits from drop-in compatibility and up to 90% lifecycle emissions cuts, enabling suppliers to layer premium pricing on corporate net-zero procurement contracts. Nonetheless, feedstock availability and competition with renewable diesel limit near-term scaling, particularly in North America, where conventional LPG oversupply narrows green premiums.
Adoption pathways differ across regions. Europe leans on used cooking oil and waste-based HVO routes, while the United States favors HEFA processes piggybacking on existing renewable diesel plants. Asia's bio-LPG roll-out remains nascent but could accelerate as Japan and South Korea unveil aviation decarbonization strategies that integrate co-product streams. The liquefied petroleum gas market share tilts toward renewable molecules, therefore deepens over the outlook, though absolute volumes remain led by fossil NGLs until at least 2030. This dual-track supply system encourages incumbents to hedge by investing in shale-linked expansions and emerging biorefineries.
The Liquefied Petroleum Gas (LPG) Market Report is Segmented by Source of Production (Refinery-Derived LPG, Natural Gas Liquids, and Bio-LPG/Renewable Propane), Distribution Channel (Cylinder Gas, Pipeline and Virtual Pipeline, and Bulk and Retail Bulk Supply), Application (Residential and Commercial Cooking/Heating, Petrochemical Feedstock, Autofuel/Autogas, and More), and Geography (North America, Europe, Asia-Pacific, and More).
Geography Analysis
Asia-Pacific held 43.60% of global revenue in 2025 and is expected to maintain a 5.38% CAGR to 2031 as petrochemical demand offsets urban induction conversions. China's 22.6 million-t PDH capacity ensures sustained seaborne propane pull, even with domestic economic moderation. India's 24% import surge in 2024 will taper as subsidies tighten, yet cooking gas remains critical for rural inclusion programs. Indonesia's roadmap to cut LPG usage 31% by 2050 introduces headwinds, though Southeast Asian industrial and tourism expansions cushion overall volumes. Japan and South Korea keep steady industrial baseloads, whereas Vietnam and the Philippines are emerging bright spots thanks to population growth and robust construction sectors.
North America leverages a 2.13 million b/d propane production platform, exporting more than 70% of output despite dock congestion. Canada's Keyera acquisition of Plains NGL assets for USD 5.15 billion integrates storage and fractionation, enhancing supply redundancy into Pacific basins. Mexico continues to benefit from cross-border pipeline connections that backstop domestic shortfalls, while specialty distributors expand virtual pipelines into underserved central plateau cities.
Europe grapples with post-Russian supply diversification: Poland's dependence has pushed traders toward US and Middle Eastern cargos at premium freight rates. The United Kingdom's GBP 600 million renewable propane drive signals strategic hedging, and OMV Petrom's Petrobrazi investment cements Southeast Europe's first major SAF-bio-LPG hub. Middle Eastern producers, chiefly Qatar and the UAE, add 9.4 million t of new capacity by 2030, enabling competitive offers into Asia and eroding US share in that corridor. Sub-Saharan Africa remains under-supplied; South Africa's R1 billion Richards Bay storage came online to stabilize regional availability. Latin America's growth is curtailed by cylinder safety incidents, but Colombia and Peru eye pipeline modernization to enhance reliability and lower end-user costs.
- BP plc
- Exxon Mobil Corporation
- Shell plc
- TotalEnergies SE
- Chevron Corporation
- ConocoPhillips
- Abu Dhabi National Oil Company (ADNOC)
- QatarEnergy
- Gazprom PJSC
- Novatek PAO
- China Petroleum & Chemical Corporation (Sinopec)
- China National Petroleum Corporation (CNPC)
- Indian Oil Corporation Ltd
- Reliance Industries Ltd (Reliance Gas)
- SHV Energy B.V.
- UGI Corp / AmeriGas
- Ferrellgas Partners LP
- Petronas
- PTT Public Company Ltd
- KazMunayGas
Additional Benefits:
- The market estimate (ME) sheet in Excel format
- 3 months of analyst support
TABLE OF CONTENTS
1 Introduction
- 1.1 Study Assumptions & Market Definition
- 1.2 Scope of the Study
2 Research Methodology
3 Executive Summary
4 Market Landscape
- 4.1 Market Overview
- 4.2 Market Drivers
- 4.2.1 Shift toward LPG-ready hybrid cook-stove programmes (India, Indonesia)
- 4.2.2 Petrochemical feedstock demand boom in emerging Asia
- 4.2.3 Accelerating refinery upgrades for IMO-2020 compliant fuels
- 4.2.4 Rural household electrification lag sustaining cylinder demand (Africa)
- 4.2.5 Subsidy reforms boosting commercial sector uptake (Middle East)
- 4.2.6 Renewable-propane scale-up in North America & EU decarbonization agendas
- 4.3 Market Restraints
- 4.3.1 Price volatility linked to US shale export arbitrage
- 4.3.2 Accelerating induction cooking penetration in urban China & EU
- 4.3.3 Stricter methane-intensity rules favoring piped natural gas over LPG
- 4.3.4 Cylinder logistics safety incidents undermining public perception (LATAM)
- 4.4 Supply-Chain Analysis
- 4.5 Regulatory Landscape
- 4.6 Technological Outlook
- 4.7 Porter's Five Forces
- 4.7.1 Bargaining Power of Suppliers
- 4.7.2 Bargaining Power of Consumers
- 4.7.3 Threat of New Entrants
- 4.7.4 Threat of Substitute Products & Services
- 4.7.5 Intensity of Competitive Rivalry
5 Market Size & Growth Forecasts
- 5.1 By Source of Production
- 5.1.1 Refinery-derived LPG
- 5.1.2 Natural Gas Liquids (Associated Gas, NGLs)
- 5.1.3 Bio-LPG/Renewable Propane
- 5.2 By Distribution Channel
- 5.2.1 Cylinder (Packaged) Gas
- 5.2.2 Bulk and Retail Bulk Supply
- 5.2.3 Pipeline and Virtual Pipeline
- 5.3 By Application
- 5.3.1 Residential and Commercial Cooking/Heating
- 5.3.2 Industrial and Commercial Processing
- 5.3.3 Autofuel/Autogas
- 5.3.4 Petrochemical Feedstock
- 5.3.5 Agriculture and Others
- 5.4 By Geography
- 5.4.1 North America
- 5.4.1.1 United States
- 5.4.1.2 Canada
- 5.4.1.3 Mexico
- 5.4.2 Europe
- 5.4.2.1 Germany
- 5.4.2.2 United Kingdom
- 5.4.2.3 France
- 5.4.2.4 Italy
- 5.4.2.5 Russia
- 5.4.2.6 Rest of Europe
- 5.4.3 Asia-Pacific
- 5.4.3.1 China
- 5.4.3.2 India
- 5.4.3.3 Japan
- 5.4.3.4 South Korea
- 5.4.3.5 ASEAN Countries
- 5.4.3.6 Rest of Asia-Pacific
- 5.4.4 South America
- 5.4.4.1 Brazil
- 5.4.4.2 Argentina
- 5.4.4.3 Rest of South America
- 5.4.5 Middle East and Africa
- 5.4.5.1 Saudi Arabia
- 5.4.5.2 United Arab Emirates
- 5.4.5.3 South Africa
- 5.4.5.4 Egypt
- 5.4.5.5 Rest of Middle East and Africa
- 5.4.1 North America
6 Competitive Landscape
- 6.1 Market Concentration
- 6.2 Strategic Moves (M&A, Partnerships, PPAs)
- 6.3 Market Share Analysis (Market Rank/Share for key companies)
- 6.4 Company Profiles (includes Global level Overview, Market level overview, Core Segments, Financials as available, Strategic Information, Products & Services, and Recent Developments)
- 6.4.1 BP plc
- 6.4.2 Exxon Mobil Corporation
- 6.4.3 Shell plc
- 6.4.4 TotalEnergies SE
- 6.4.5 Chevron Corporation
- 6.4.6 ConocoPhillips
- 6.4.7 Abu Dhabi National Oil Company (ADNOC)
- 6.4.8 QatarEnergy
- 6.4.9 Gazprom PJSC
- 6.4.10 Novatek PAO
- 6.4.11 China Petroleum & Chemical Corporation (Sinopec)
- 6.4.12 China National Petroleum Corporation (CNPC)
- 6.4.13 Indian Oil Corporation Ltd
- 6.4.14 Reliance Industries Ltd (Reliance Gas)
- 6.4.15 SHV Energy B.V.
- 6.4.16 UGI Corp / AmeriGas
- 6.4.17 Ferrellgas Partners LP
- 6.4.18 Petronas
- 6.4.19 PTT Public Company Ltd
- 6.4.20 KazMunayGas
7 Market Opportunities & Future Outlook
- 7.1 White-space & Unmet-Need Assessment

