
PUBLISHER: Mordor Intelligence | PRODUCT CODE: 1910807

PUBLISHER: Mordor Intelligence | PRODUCT CODE: 1910807
Float Glass - Market Share Analysis, Industry Trends & Statistics, Growth Forecasts (2026 - 2031)
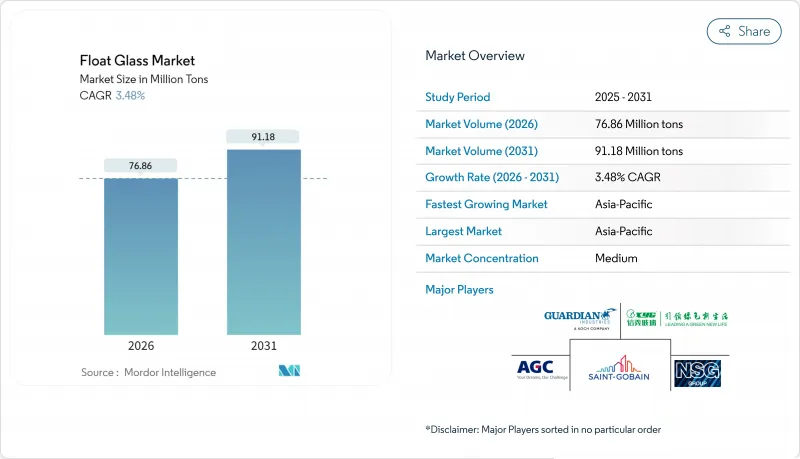
Float Glass Market size in 2026 is estimated at 76.86 million tons, growing from 2025 value of 74.27 million tons with 2031 projections showing 91.18 million tons, growing at 3.48% CAGR over 2026-2031.
Surging demand for high-performance substrates in solar, automotive, and energy-efficient facades supports steady volume gains even as traditional construction end-uses mature. Manufacturers leverage process automation and furnace upgrades to curb the volatility stemming from soda-ash and natural-gas input costs, while decarbonization investments safeguard access to export markets facing carbon-based trade barriers. Competitive differentiation now rests less on throughput and more on precision, reliability, and the capacity to deliver ultra-clear, thin, or multi-functional sheets that command premium margins. Rapid installations of utility-scale solar arrays in North America and the shift toward low-carbon building envelopes in Europe are reshaping global procurement models, forcing Asian suppliers to accelerate emission-reduction roadmaps to maintain share. With multibillion-dollar capacity additions scheduled in both China and the United States, the float glass market continues to rebalance toward regionalized supply chains that prioritize resilience and carbon efficiency.
Global Float Glass Market Trends and Insights
Construction-Sector Expansion in Emerging Economies
Decisive public-sector outlays on transport, housing, and industrial corridors are fueling sustained purchases of architectural glass across South and Southeast Asia. India's construction pipeline equals 3.5 times the sector's annual operating revenue. Thailand's Eastern Economic Corridor continues to absorb large sheet volumes even as labor shortages slow project execution. With regional float lines already running at utilization rates below 80%, producers situated near these demand hubs can ramp shipments swiftly without green-field investments. As a result, the float glass market will rely on fast-growing emerging economies to offset plateauing consumption in mature Western countries.
Automotive Lightweighting Raises Glazing M2 Per Vehicle
Electrification mandates have made weight a premium KPI for automakers, yet advanced driver-assistance systems, panoramic roofs, and immersive infotainment screens are simultaneously expanding the glass surface area per car. This paradox underpins a structural upswing for the float glass market, as OEMs specify thinner yet larger laminated or tempered panes that integrate antennas, heaters, and head-up-display coatings. Fuyao's decision to inject CNY 5.8 billion (USD 804 million) into new float lines dedicated to electrified vehicle platforms illustrates the scale of the opportunity. The resulting requirement for optical clarity and electromagnetic transparency supports premium pricing, ensuring that volume growth feeds directly into revenue and margin expansion for technologically capable suppliers.
Polymer and Polycarbonate Substitutes in Safety Glazing
Automotive and architectural standards permit polycarbonate solutions that weigh 40-50% less than laminated glass while matching impact resistance. Weight-sensitive OEMs therefore experiment with polymer roofs and rear windows; however, scratch performance, UV stability, and optical distortion issues still confine usage to niche placements. Glass makers answer with thinner, lighter laminates using advanced PVB interlayers, as evidenced by Eastman's European capacity expansion. The resulting material joust moderates the float glass market CAGR but also catalyzes innovation, widening the product envelope and raising entry barriers.
Other drivers and restraints analyzed in the detailed report include:
- Utility-Scale Solar Build-Outs Boost Demand for Low-Iron Float Glass
- BIPV Facade Regulations Spur Ultra-Clear Low-Iron Substrates
- EU Carbon Border Adjustment Mechanism Compliance Costs
For complete list of drivers and restraints, kindly check the Table Of Contents.
Segment Analysis
Clear sheet controlled 62.70% of the float glass market share in 2025 and will register the highest 3.79% CAGR through 2031. This dominance reflects unrivaled versatility: facade glazing, automotive windscreens, and low-iron solar covers all demand transparency levels unattainable by tinted or patterned variants. Manufacturers channel research and development budgets into purification and melt-homogeneity technologies that suppress bubble content and iron residue, securing margins that offset commodity headwinds. Tinted and patterned sheets persist as design-driven niches, yet their uptake follows cyclical architectural trends rather than structural technology shifts.
Extra-clear low-ferrous grades sit at the premium apex, powered by solar boom economics and luxury facade aesthetics. NSG's Pilkington Mirai(TM) and Xinyi's 2.0 mm glass lines exemplify the emphasis on both embodied-carbon cuts and extreme thinness. As N-type solar modules cascade through production lines, sheet rejection rates rise, paradoxically lifting clear-glass tonnage per installed gigawatt. Integrated sand quarries and real-time impurity scanners thus become critical competitive assets across the float glass market.
The Float Glass Report is Segmented by Product Type (Clear, Tinted, Patterned, Wired, and Extra Clear/Low Ferrous), Application (Building and Construction, Automotive, Solar Glass, and Other Applications), and Geography (Asia-Pacific, North America, Europe, South America, and Middle-East and Africa). The Market Forecasts are Provided in Terms of Volume (Tons).
Geography Analysis
Asia-Pacific dominates the float glass market, supplying 62.65% of global output in 2025 and advancing at a 3.92% CAGR to 2031. China anchors the base with mega-scale kiln clusters, while India rides an unprecedented USD 1.5 trillion construction upcycle that absorbs large sheets for residential towers and logistics parks. Thailand's infrastructure spend around the Eastern Economic Corridor cushions regional demand dips tied to residential slowdowns. Yet Asian exporters must navigate rising freight charges and looming CBAM levies, prompting pilot investments in hybrid furnaces and rooftop solar to reduce shipped-ton CO2.
Europe, historically the cradle of float innovation, is now the crucible for low-carbon manufacturing. Saint-Gobain's ORAE series combines high recycled content with cradle-to-cradle certification, while AGC Interpane's upgrades in Germany and Austria elevate line efficiencies despite weak housing starts.
North America capitalizes on nearshoring dynamics and clean-energy incentives. Fuyao's USD 400 million boost to its Illinois float facility ensures just-in-time supply for Midwest EV plants. Combined with the Inflation Reduction Act's manufacturing tax credits, these moves shift import reliance toward domestically melted sheets, narrowing latency and carbon footprints. South America and the Middle East and Africa deliver incremental tonnage via stadium builds, desalination projects, and smart-city launches, but limited local capacity keeps per-capita consumption below mature-market norms.
- AGC Inc.
- BG
- CARDINAL GLASS INDUSTRIES, INC
- China Glass Holding
- China Luoyang Float Glass Group Co., Ltd.
- Flat Glass Group Co., Ltd
- Fuyao Group
- Guardian Industries Holdings
- Kibing Group
- Nippon Sheet Glass Co., Ltd
- PRESS GLASS Holding SA
- PT Mulia Industrindo Tbk
- Saint-Gobain
- SCHOTT
- Sisecam
- Taiwan Glass Ind. Corp.
- Vitro
- Xinyi Glass Holdings Limited
Additional Benefits:
- The market estimate (ME) sheet in Excel format
- 3 months of analyst support
TABLE OF CONTENTS
1 Introduction
- 1.1 Study Assumptions and Market Definition
- 1.2 Scope of the Study
2 Research Methodology
3 Executive Summary
4 Market Landscape
- 4.1 Market Overview
- 4.2 Market Drivers
- 4.2.1 Construction Sector Expansion in Emerging Economies
- 4.2.2 Automotive Lightweighting Raises Glazing M2 Per Vehicle
- 4.2.3 Utility-Scale Solar Buildouts Boost Demand for Low-Iron Float Glass
- 4.2.4 Urban Regeneration Mandates Energy-Efficient Facades
- 4.2.5 BIPV Facade Regulations Spur Ultra-Clear Low-Iron Substrates
- 4.3 Market Restraints
- 4.3.1 Volatile Soda-Ash and Natural-Gas Prices
- 4.3.2 Polymer and Polycarbonate Substitutes in Safety Glazing
- 4.3.3 EU Carbon Border Adjustment Mechanism Compliance Costs (under-radar)
- 4.4 Value Chain Analysis
- 4.5 Raw Material Analysis
- 4.5.1 Sand
- 4.5.2 Limestone
- 4.5.3 Soda Ash
- 4.5.4 Dolomite
- 4.6 Porter's Five Forces
- 4.6.1 Bargaining Power of Suppliers
- 4.6.2 Bargaining Power of Buyers
- 4.6.3 Threat of New Entrants
- 4.6.4 Threat of Substitutes
- 4.6.5 Degree of Competition
5 Market Size and Growth Forecasts (Value and Volume)
- 5.1 By Product Type
- 5.1.1 Clear
- 5.1.2 Tinted
- 5.1.3 Patterned
- 5.1.4 Wired
- 5.1.5 Extra Clear/Low Ferrous Floated Glass
- 5.2 By Application
- 5.2.1 Building and Construction
- 5.2.2 Automotive
- 5.2.3 Solar Glass
- 5.2.4 Other Applications
- 5.3 By Geography
- 5.3.1 Asia-Pacific
- 5.3.1.1 China
- 5.3.1.2 India
- 5.3.1.3 Japan
- 5.3.1.4 South Korea
- 5.3.1.5 Vietnam
- 5.3.1.6 Thailand
- 5.3.1.7 Indonesia
- 5.3.1.8 Malaysia
- 5.3.1.9 Rest of Asia-Pacific
- 5.3.2 North America
- 5.3.2.1 United States
- 5.3.2.2 Canada
- 5.3.2.3 Mexico
- 5.3.3 Europe
- 5.3.3.1 Germany
- 5.3.3.2 United Kingdom
- 5.3.3.3 France
- 5.3.3.4 Italy
- 5.3.3.5 Spain
- 5.3.3.6 Russia
- 5.3.3.7 Nordic Countries
- 5.3.3.8 Rest of Europe
- 5.3.4 South America
- 5.3.4.1 Brazil
- 5.3.4.2 Argentina
- 5.3.4.3 Colombia
- 5.3.4.4 Rest of South America
- 5.3.5 Middle-East and Africa
- 5.3.5.1 Saudi Arabia
- 5.3.5.2 Nigeria
- 5.3.5.3 Qatar
- 5.3.5.4 United Arab Emirates
- 5.3.5.5 Egypt
- 5.3.5.6 South Africa
- 5.3.5.7 Rest of Middle-East and Africa
- 5.3.1 Asia-Pacific
6 Competitive Landscape
- 6.1 Market Concentration
- 6.2 Strategic Moves
- 6.3 Market Share (%)/Ranking Analysis
- 6.4 Company Profiles (includes Global level Overview, Market level overview, Core Segments, Financials as available, Strategic Information, Market Rank/Share for key companies, Products and Services, and Recent Developments)
- 6.4.1 AGC Inc.
- 6.4.2 BG
- 6.4.3 CARDINAL GLASS INDUSTRIES, INC
- 6.4.4 China Glass Holding
- 6.4.5 China Luoyang Float Glass Group Co., Ltd.
- 6.4.6 Flat Glass Group Co., Ltd
- 6.4.7 Fuyao Group
- 6.4.8 Guardian Industries Holdings
- 6.4.9 Kibing Group
- 6.4.10 Nippon Sheet Glass Co., Ltd
- 6.4.11 PRESS GLASS Holding SA
- 6.4.12 PT Mulia Industrindo Tbk
- 6.4.13 Saint-Gobain
- 6.4.14 SCHOTT
- 6.4.15 Sisecam
- 6.4.16 Taiwan Glass Ind. Corp.
- 6.4.17 Vitro
- 6.4.18 Xinyi Glass Holdings Limited
7 Market Opportunities and Future Outlook
- 7.1 White-space and Unmet-need Assessment

