
PUBLISHER: Mordor Intelligence | PRODUCT CODE: 1910928

PUBLISHER: Mordor Intelligence | PRODUCT CODE: 1910928
Intermodal Freight Transportation - Market Share Analysis, Industry Trends & Statistics, Growth Forecasts (2026 - 2031)
The intermodal freight transportation market size in 2026 is estimated at USD 31.18 billion, growing from 2025 value of USD 27.52 billion with 2031 projections showing USD 58.15 billion, growing at 13.28% CAGR over 2026-2031.
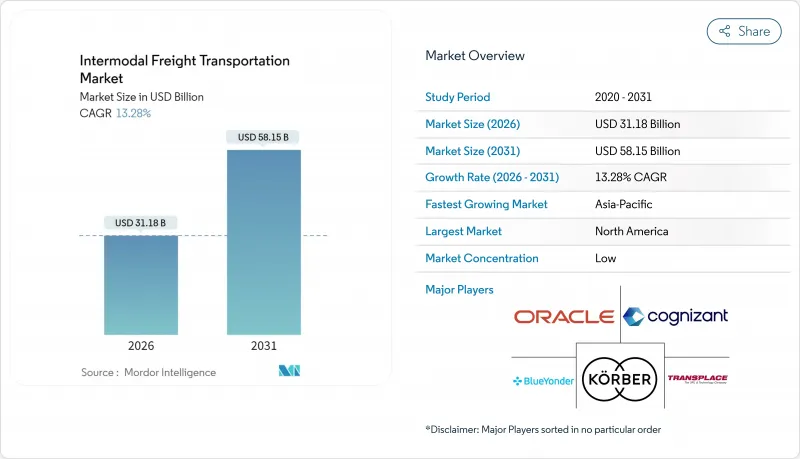
Rising e-commerce volumes, accelerating supply-chain digitalization, and policy-driven decarbonization goals are converging to reshape modal choices and propel demand for integrated logistics solutions. Public spending on infrastructure, including the USD 10 billion automated rail corridor between Laredo and Monterrey, as well as large-scale Belt and Road rail investments, has begun to unlock latent capacity while redirecting continental trade flows. Technology adoption is expanding real-time visibility, shrinking dwell times, and increasing asset utilization rates, while sustainability mandates reinforce the economic case for rail-road and maritime-rail combinations. Competitive differentiation is shifting from pure asset scale to the ability to orchestrate software, analytics, and certified low-carbon services within a single multimodal platform.
Global Intermodal Freight Transportation Market Trends and Insights
Digitisation of Global Supply Chains Enhances Real-Time Visibility
Widespread adoption of cloud-based logistics platforms now connects carriers, terminals, and shippers within unified data ecosystems that process billions of transactions per year . Predictive analytics reduces dwell times by double-digit percentages and supports dynamic routing that lifts asset-utilization rates across rail, road, and maritime legs. IoT-equipped smart containers transmit temperature, humidity, and location data, reinforcing cargo integrity and lowering insurance costs. Blockchain-enabled records offer immutable proof-of-delivery that resolves historic disputes among modal operators, while API-rich architectures ease integration with legacy EDI standards. Collectively, these digital building blocks are turning the intermodal freight transportation market into a data-driven network capable of near-real-time course correction at scale.
Expansion of E-commerce Volumes Demanding Flexible Freight Options
B2C parcel demand continues to grow faster than total merchandise trade, forcing shippers to shift from point-to-point full-truckload moves toward hub-and-spoke intermodal solutions that balance speed and cost. Amazon alone commissioned 15 new North American intermodal facilities during 2024 to shorten the average "middle-mile" hop. Two-day delivery expectations and enlarging cross-border order books channel higher volumes onto rail-road corridors within the 500-1,500-mile sweet spot. Omnichannel retailers also reposition inventory more frequently, raising demand for agile mode-switching that keeps shelves stocked without inflating working capital.
Port Congestion and Chassis Shortages Escalating Turn-Round Times
Average container dwell time at major U.S. gateways reached 5.2 days in 2024, up from 3.8 days in 2019, as chassis availability fell short of peak-season demand. Tariffs on Chinese-built equipment and limited domestic manufacturing capacity left supply at 78% of required levels. Intermodal operators incurred daily penalty fees near USD 150 for late container returns, undermining cost competitiveness versus long-haul trucking. Automation projects promise relief but require multiyear deployments, keeping this bottleneck on short-term risk radars.
Other drivers and restraints analyzed in the detailed report include:
- Shift Toward Decarbonised Logistics Through Modal-Shift Incentives
- Government Investments in Rail-Road Terminals and Dry Ports
- Acute Shortage of Intermodal-Qualified Truck Drivers
For complete list of drivers and restraints, kindly check the Table Of Contents.
Segment Analysis
Software revenues are growing at 13.43% CAGR, outpacing the larger services category that still accounts for 60.42% of 2025 turnover within the intermodal freight transportation market. Blue Yonder's AI platform already ingests over 2 billion shipment decisions each year, enhancing lane selection, load consolidation, and capacity prediction. Cloud deployment models lower entry barriers, enabling mid-market shippers to adopt robust TMS and WMS capabilities without heavy capital outlays.
Service providers maintain their lead by bundling consulting, implementation, and managed services that de-risk software launches and drive ongoing optimization. Oracle's 2024 acquisition of Cerner's supply-chain assets strengthened its healthcare footprint, while Cognizant's alliance with Microsoft Azure expanded multitenant visibility options for pharmaceuticals. Compliance modules covering FDA and DOT mandates elevate demand for specialized software, and subscription pricing stabilizes revenue streams for vendors. The intermodal freight transportation market size linked to software is set to widen as predictive analytics becomes indispensable for sustainability reporting and on-demand capacity orchestration.
Air-road pairings held 45.62% of 2025 modal revenue, yet rail-road services are advancing at a 13.51% CAGR through 2031 and shifting the revenue mix of the intermodal freight transportation market. Sustained diesel price volatility and a 40% fuel-efficiency edge make rail compelling for hauls over 500 miles. The USD 3 billion North Pacific Green Corridor electrified rail project connecting Los Angeles and Seattle underpins this pivot.
Air-road solutions remain irreplaceable for high-value, time-sensitive cargo. FedEx's USD 4 billion Memphis World Hub expansion added rail links that compress domestic transit by up to half a day, blending airspeed with rail economics . Maritime-road and maritime-rail combinations continue to serve bulk and long-distance lanes, while robotics and autonomous trucks may eventually rebalance mode shares by shrinking final-mile labor costs.
The Intermodal Freight Transportation Market is Segmented by Component (Software, Service), Transportation Mode (Rail and Road Transport, Air and Road Transport, and More), End-User Industry (Industrial and Manufacturing, and More), Container Type (Dry Containers, Refrigerated Containers, and More), Service Type (Transportation Planning, and More), and Geography. The Market Forecasts are Provided in Terms of Value (USD).
Geography Analysis
Asia Pacific accounted for 29.33% of 2025 revenue and is poised to grow at 13.69% CAGR, firmly establishing itself as the fastest-expanding region in the intermodal freight transportation market. China-Europe Railway Express services tallied more than 17,000 trains in 2024, shaving 10-15 days off maritime schedules for high-value goods. India's Dedicated Freight Corridor and ASEAN cross-border rail links are synchronizing production bases in Vietnam, Thailand, and Indonesia with major seaports, broadening the network's reach.
North America ranks second by revenue, underpinned by USMCA-aligned trade lanes and extensive infrastructure investment. The intermodal freight transportation market size attached to the region will benefit from the Laredo-Monterrey corridor and the Canadian Pacific Kansas City single-line rail network, both of which streamline border crossings and reduce interchange dwell time. Driver shortages and chassis deficits temper near-term upside but do not derail the long-term growth trajectory supported by government grants and private capex.
Europe focuses on emission reduction and cross-border standardization. Fit for 55 carbon rules and EUR 25 billion (USD 27.3 billion) in TEN-T funding are accelerating a pivot to rail-centric itineraries for freight under 1,500 km. Automated rail terminals in Germany and port upgrades in the United Kingdom buffer post-Brexit trade realignment. Emerging regions such as South America, the Middle East, and Africa remain smaller in absolute terms yet present targeted opportunities along commodity corridors and Belt and Road-financed infrastructure tranches.
- Oracle Corporation
- Cognizant Technology Solutions Corporation
- Karber AG
- Blue Yonder Group Inc.
- Transplace LLC
- Wabtec Corporation
- The Descartes Systems Group Inc.
- Motorola Solutions Inc.
- Elemica Inc.
- Envase Technologies LLC
- C.H. Robinson Worldwide Inc.
- Deutsche Bahn AG
- Kuehne + Nagel International AG
- DSV A/S
- FedEx Corporation
- United Parcel Service Inc.
- XPO Logistics Inc.
- J.B. Hunt Transport Services Inc.
- Maersk Line A/S
- DP World PLC
Additional Benefits:
- The market estimate (ME) sheet in Excel format
- 3 months of analyst support
TABLE OF CONTENTS
1 INTRODUCTION
- 1.1 Study Assumptions and Market Definition
- 1.2 Scope of the Study
2 RESEARCH METHODOLOGY
3 EXECUTIVE SUMMARY
4 MARKET LANDCSAPE
- 4.1 Market Overview
- 4.2 Market Drivers
- 4.2.1 Digitisation of global supply chains enhances real-time visibility
- 4.2.2 Expansion of e-commerce volumes demanding flexible freight options
- 4.2.3 Shift toward decarbonised logistics through modal shift incentives
- 4.2.4 Government investments in rail-road terminals and dry ports
- 4.2.5 Growing availability of smart containers with IoT tracking
- 4.2.6 Deployment of green corridors on key maritime trade lanes
- 4.3 Market Restraints
- 4.3.1 Fragmented data standards limit system interoperability
- 4.3.2 Port congestion and chassis shortages escalating turn-round times
- 4.3.3 Acute shortage of intermodal-qualified truck drivers
- 4.3.4 Rising cyber-security risks across connected terminal assets
- 4.4 Industry Value / Supply-Chain Analysis
- 4.5 Regulatory Landscape
- 4.6 Technological Outlook
- 4.7 Impact of Macroeconomic Factors
- 4.8 Porter's Five Forces Analysis
- 4.8.1 Bargaining Power of Buyers
- 4.8.2 Bargaining Power of Suppliers
- 4.8.3 Threat of New Entrants
- 4.8.4 Threat of Substitutes
- 4.8.5 Intensity of Competitive Rivalry
5 MARKET SIZE AND GROWTH FORECASTS (VALUE)
- 5.1 By Component
- 5.1.1 Software
- 5.1.2 Service
- 5.2 By Transportation Mode
- 5.2.1 Rail and Road Transport
- 5.2.2 Air and Road Transport
- 5.2.3 Maritime and Road Transport
- 5.2.4 Other Transportation Modes
- 5.3 By End-User Industry
- 5.3.1 Industrial and Manufacturing
- 5.3.2 Oil and Gas
- 5.3.3 Consumer and Retail
- 5.3.4 Food and Beverage
- 5.3.5 Construction
- 5.3.6 Other End-User Industries
- 5.4 By Container Type
- 5.4.1 Dry Containers
- 5.4.2 Refrigerated Containers
- 5.4.3 Tank Containers
- 5.4.4 Flat-rack and Open-top Containers
- 5.5 By Service Type
- 5.5.1 Transportation Planning
- 5.5.2 Fleet Management
- 5.5.3 Warehousing and Distribution
- 5.5.4 Other Services
- 5.6 By Geography
- 5.6.1 North America
- 5.6.1.1 United States
- 5.6.1.2 Canada
- 5.6.1.3 Mexico
- 5.6.2 South America
- 5.6.2.1 Brazil
- 5.6.2.2 Argentina
- 5.6.2.3 Rest of South America
- 5.6.3 Europe
- 5.6.3.1 Germany
- 5.6.3.2 United Kingdom
- 5.6.3.3 France
- 5.6.3.4 Italy
- 5.6.3.5 Spain
- 5.6.3.6 Russia
- 5.6.3.7 Rest of Europe
- 5.6.4 Asia Pacific
- 5.6.4.1 China
- 5.6.4.2 Japan
- 5.6.4.3 India
- 5.6.4.4 South Korea
- 5.6.4.5 Southeast Asia
- 5.6.4.6 Australia and New Zealand
- 5.6.4.7 Rest of Asia Pacific
- 5.6.5 Middle East
- 5.6.5.1 Saudi Arabia
- 5.6.5.2 United Arab Emirates
- 5.6.5.3 Turkey
- 5.6.5.4 Rest of Middle East
- 5.6.6 Africa
- 5.6.6.1 South Africa
- 5.6.6.2 Nigeria
- 5.6.6.3 Egypt
- 5.6.6.4 Rest of Africa
- 5.6.1 North America
6 COMPETITIVE LANDSCAPE
- 6.1 Market Concentration
- 6.2 Strategic Moves
- 6.3 Market Share Analysis
- 6.4 Company Profiles (includes Global level Overview, Market level overview, Core Segments, Financials as available, Strategic Information, Market Rank/Share for key companies, Products and Services, and Recent Developments)
- 6.4.1 Oracle Corporation
- 6.4.2 Cognizant Technology Solutions Corporation
- 6.4.3 Karber AG
- 6.4.4 Blue Yonder Group Inc.
- 6.4.5 Transplace LLC
- 6.4.6 Wabtec Corporation
- 6.4.7 The Descartes Systems Group Inc.
- 6.4.8 Motorola Solutions Inc.
- 6.4.9 Elemica Inc.
- 6.4.10 Envase Technologies LLC
- 6.4.11 C.H. Robinson Worldwide Inc.
- 6.4.12 Deutsche Bahn AG
- 6.4.13 Kuehne + Nagel International AG
- 6.4.14 DSV A/S
- 6.4.15 FedEx Corporation
- 6.4.16 United Parcel Service Inc.
- 6.4.17 XPO Logistics Inc.
- 6.4.18 J.B. Hunt Transport Services Inc.
- 6.4.19 Maersk Line A/S
- 6.4.20 DP World PLC
7 MARKET OPPORTUNITIES AND FUTURE OUTLOOK
- 7.1 White-space and Unmet-need Assessment

