
PUBLISHER: Mordor Intelligence | PRODUCT CODE: 1910942

PUBLISHER: Mordor Intelligence | PRODUCT CODE: 1910942
Maritime Freight Transport - Market Share Analysis, Industry Trends & Statistics, Growth Forecasts (2026 - 2031)
The Maritime Freight Transport Market was valued at USD 599.78 billion in 2025 and estimated to grow from USD 632.36 billion in 2026 to reach USD 823.57 billion by 2031, at a CAGR of 5.43% during the forecast period (2026-2031).
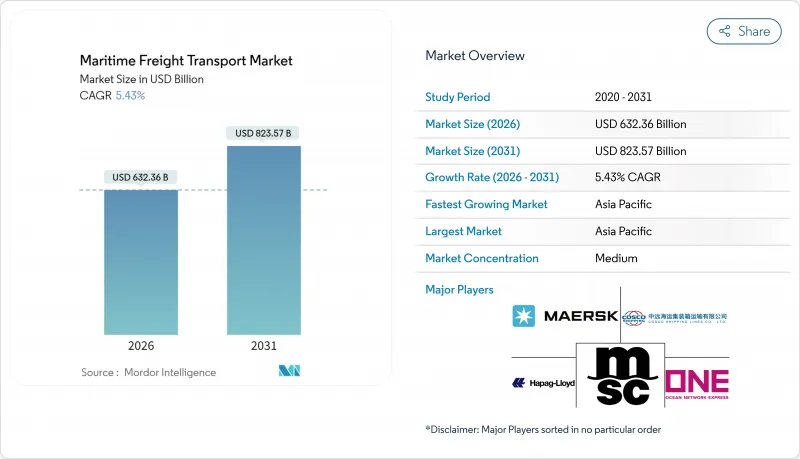
Sustained expansion springs from resilient global trade volumes, the rerouting of vessels around congestion and conflict zones that inflates ton-mile demand, and the accelerating shift of cargo toward South-South corridors that intensify intra-Asian flows. Compliance with the EU Emissions Trading System (EU ETS) adds USD 206 per metric ton to operating costs in 2025 but simultaneously accelerates fleet renewal toward low-carbon tonnage, supporting long-run competitiveness. Alliance realignments such as the Gemini Cooperation between Maersk and Hapag-Lloyd recalibrate slot allocation across East-West lanes, raising schedule reliability targets to 90% and sharpening service differentiation. Digital freight platforms that now govern more than 80% of container transactions provide real-time capacity balancing, cut average dwell time by 12%, and help carriers monetize empty repositioning legs.
Global Maritime Freight Transport Market Trends and Insights
Surge in South-South Intra-Asian Trade Corridors
ASEAN surpassed the European Union as China's top trading partner in 2023 at USD 468.8 billion, a 10.5% jump that cements intra-Asian cargo loops as the new growth engine. Progressive tariff eliminations under ACFTA streamline flows that bypass Western transshipment hubs, while China's 84-mile Pinglu Canal slated for 2026 will move 89 million tons annually and slice USD 725 million from supply-chain costs. Manufacturing migration toward Southeast Asia reinforces near-port industrial clusters, amplifying feeder demand to secondary gateways. The resulting cargo density underpins scale investments in 15,000 TEU workhorses optimized for shorter hauls yet higher turn-round frequencies. Collectively, these dynamics contribute an estimated 1.2 percentage-points to the Maritime freight transport market CAGR forecast period.
Near-shoring Drives Short-Sea Feeder Demand
U.S.-Mexico truck crossings hit record levels in 2024, validating near-shoring's spillover into Gulf and Caribbean feeder loops. Mainline carriers now skip smaller Gulf ports, contracting regional specialists for hub-and-spoke shuttles that compress door-to-door cycles by two to four days. X-Press Feeders' pact with six European ports to create green corridors exemplifies operators capturing rising short-sea volumes while satisfying Scope 3 emission objectives. Executives cite logistics cost reduction as the single largest incentive, with 41% prioritizing proximity over global scale. Elevated demand lifts vessel utilization and daily charter rates for 1,500-2,000 TEU ships, translating into a 0.8 percentage-point uptick in the Maritime freight transport market growth trajectory.
Chronic Port-Side Infrastructure Bottlenecks
Congestion peaked in 2025 as Singapore and Colombo absorbed Cape-routed vessels, causing yard utilization to exceed 90% and average berth wait times to triple. Shanghai processed a record 5 million TEU in January 2025 ahead of U.S. tariff enactments, stressing yard equipment even after adding 18 fully automated terminals. Los Angeles and Long Beach struggle with chassis shortages, while the Malacca Strait faces geopolitical disruptions and climate-driven draft limitations. Investment lags in gate automation and hinterland rail links hamper cargo velocity, subtracting 1.1 percentage-points from the Maritime freight transport market's long-run CAGR.
Other drivers and restraints analyzed in the detailed report include:
- EU-ETS on Maritime Emissions Reshapes Fleet Economics
- Digital Freight Platforms Enable Real-Time Capacity Matching
- Oversupply Risk from Record Container-Ship Orderbook 2023-26
For complete list of drivers and restraints, kindly check the Table Of Contents.
Segment Analysis
Dry bulk holds the lion's share, accounting for 28.65% of Maritime freight transport market size in 2025 on the back of China's 165 million-ton iron-ore and coal restocking drive. However, a 36 million dwt delivery slate scheduled for 2025 risks dampening TCE rates despite robust tonnage demand growth. Operators therefore pivot to index-linked charters to mitigate downside exposure. Overcapacity fears spur early scrapping of Handysize vessels, constraining supply in niche routes and moderating rate compression.
Liquid bulk is the standout growth engine, posting a 4.02% CAGR through 2031 as LNG liquefaction volumes scale and chemicals trades diversify. Spot VLCC earnings are forecast at USD 51,600 per day for 2025, stimulating time-charter interest among energy majors. Tanker owners install dual-fuel capability to capture green-premium cargoes, while port operators invest in cryogenic export arms to service ammonia-ready tonnage. The strengthening liquid bulk trajectory adds needed diversity to the Maritime freight transport market, cushioning volatility in other cargo streams.
The Maritime Freight Transport Market Report is Segmented by Cargo Type (Containerized Cargo, Dry Bulk Cargo, Liquid Bulk Cargo, General Cargo, Roll-On/Roll-Off Cargo), End-User Industry (Electronics & Semiconductors, Chemicals & Petrochemicals, Food & Beverage, and More), and Geography (North America, South America, Asia-Pacific, Europe, Middle East and Africa). The Market Forecasts are Provided in Terms of Value (USD).
Geography Analysis
Asia-Pacific commands 37.65% of Maritime freight transport market share in 2025 and is set to expand at a 5.02% CAGR to 2031, buoyed by 57% intra-regional trade dependence that diversifies growth away from Western demand cycles. Shanghai's automation blueprint-18 fully unmanned terminals-cuts crane moves per hour variance and sets new benchmarks for berth productivity. China's Pinglu Canal, capable of handling 89 million tons a year by 2026, will reduce inland transit bottlenecks and save USD 725 million annually.
North America confronts a rare 1% contraction in container throughput as tariff realignments and Section 301 levies raise costs on Chinese-built vessels beginning October 2025. Yet Mexico's trade renaissance offers partial offset, with near-shoring catalyzing Gulf feeder services and inland rail upgrades. Europe faces EUR 10 billion (USD 11.03 billion) annual ETS compliance costs that reprioritize corridor routing and bunker strategies. Simultaneously, green-corridor pilots position European ports as early-adoption nodes for alternative-fuel bunkering.
The Middle East leverages USD 4.5 billion in Saudi port investments to lift regional logistics revenue to USD 38.8 billion by 2026. IMEC promises to shorten Asia-Europe transit times by 40% via integrated rail-port linkages, underscoring the region's role in multipolar trade flows. South America capitalizes on its neutral stance; Brazilian soybean exports to China expand under disrupted supply chains. Africa's share gradually rises as Russia-Nigeria services unlock agricultural corridors for BRICS members.
- Mediterranean Shipping Company (MSC)
- A.P. Moller-Maersk
- COSCO Shipping Lines
- Hapag-Lloyd
- Ocean Network Express (ONE)
- Evergreen Marine Corp.
- HMM Co., Ltd.
- Yang Ming Marine Transport
- ZIM Integrated Shipping
- Pacific International Lines (PIL)
- SITC International
- X-Press Feeders
- Matson Inc.
- Swire Shipping
- NYK Line
- K Line
- MOL Logistics
- CMA CGM
- Wan Hai Lines
- Emirates Shipping Line
Additional Benefits:
- The market estimate (ME) sheet in Excel format
- 3 months of analyst support
TABLE OF CONTENTS
1 Introduction
- 1.1 Study Assumptions & Market Definition
- 1.2 Scope of the Study
2 Research Methodology
3 Executive Summary
4 Market Landscape
- 4.1 Market Overview
- 4.2 Market Drivers
- 4.2.1 Surge in South-South intra-Asian trade corridors
- 4.2.2 Near-shoring drives short-sea feeder demand
- 4.2.3 EU-ETS on maritime emissions reshapes fleet economics
- 4.2.4 Digital freight platforms enable real-time capacity matching
- 4.2.5 Alternative fuels adoption lowers long-term OPEX
- 4.2.6 Suez diversions & Panama expansion boost ton-miles
- 4.3 Market Restraints
- 4.3.1 Chronic port-side infrastructure bottlenecks
- 4.3.2 Oversupply risk from record container-ship orderbook 2023-26
- 4.3.3 Escalating maritime cyber-security threats
- 4.3.4 Inflation-driven bunker price volatility
- 4.4 Value / Supply-Chain Analysis
- 4.5 Regulatory Landscape
- 4.6 Technological Outlook
- 4.7 Impact of COVID-19 and Geo-Political Events
- 4.8 Porters Five Forces
- 4.8.1 Bargaining Power of Buyers
- 4.8.2 Bargaining Power of Suppliers
- 4.8.3 Threat of New Entrants
- 4.8.4 Threat of Substitutes
- 4.8.5 Competitive Rivalry
5 Market Size & Growth Forecasts (Value)
- 5.1 By Cargo Type
- 5.1.1 Containerized Cargo
- 5.1.1.1 Dry
- 5.1.1.2 Reefer
- 5.1.2 Dry Bulk Cargo
- 5.1.3 Liquid Bulk Cargo
- 5.1.4 General Cargo
- 5.1.5 Roll-On/Roll-Off Cargo
- 5.1.1 Containerized Cargo
- 5.2 By End-User Industry
- 5.2.1 Electronics & Semiconductors
- 5.2.2 Chemicals & Petrochemicals
- 5.2.3 Food & Beverage
- 5.2.4 Pharmaceuticals & Healthcare
- 5.2.5 Retail & E-commerce
- 5.2.6 Others
- 5.3 By Geography
- 5.3.1 North America
- 5.3.1.1 United States
- 5.3.1.2 Canada
- 5.3.1.3 Mexico
- 5.3.2 South America
- 5.3.2.1 Brazil
- 5.3.2.2 Peru
- 5.3.2.3 Chile
- 5.3.2.4 Argentina
- 5.3.2.5 Rest of South America
- 5.3.3 Asia-Pacific
- 5.3.3.1 India
- 5.3.3.2 China
- 5.3.3.3 Japan
- 5.3.3.4 Australia
- 5.3.3.5 South Korea
- 5.3.3.6 South East Asia (Singapore, Malaysia, Thailand, Indonesia, Vietnam, and Philippines)
- 5.3.3.7 Rest of Asia-Pacific
- 5.3.4 Europe
- 5.3.4.1 United Kingdom
- 5.3.4.2 Germany
- 5.3.4.3 France
- 5.3.4.4 Spain
- 5.3.4.5 Italy
- 5.3.4.6 BENELUX (Belgium, Netherlands, and Luxembourg)
- 5.3.4.7 NORDICS (Denmark, Finland, Iceland, Norway, and Sweden)
- 5.3.4.8 Rest of Europe
- 5.3.5 Middle East and Africa
- 5.3.5.1 United Arab of Emirates
- 5.3.5.2 Saudi Arabia
- 5.3.5.3 South Africa
- 5.3.5.4 Nigeria
- 5.3.5.5 Rest of Middle East And Africa
- 5.3.1 North America
6 Competitive Landscape
- 6.1 Market Concentration
- 6.2 Strategic Moves
- 6.3 Market Share Analysis
- 6.4 Company Profiles (includes Global level Overview, Market level overview, Core Segments, Financials as available, Strategic Information, Market Rank/Share for key companies, Products & Services, and Recent Developments)
- 6.4.1 Mediterranean Shipping Company (MSC)
- 6.4.2 A.P. Moller-Maersk
- 6.4.3 COSCO Shipping Lines
- 6.4.4 Hapag-Lloyd
- 6.4.5 Ocean Network Express (ONE)
- 6.4.6 Evergreen Marine Corp.
- 6.4.7 HMM Co., Ltd.
- 6.4.8 Yang Ming Marine Transport
- 6.4.9 ZIM Integrated Shipping
- 6.4.10 Pacific International Lines (PIL)
- 6.4.11 SITC International
- 6.4.12 X-Press Feeders
- 6.4.13 Matson Inc.
- 6.4.14 Swire Shipping
- 6.4.15 NYK Line
- 6.4.16 K Line
- 6.4.17 MOL Logistics
- 6.4.18 CMA CGM
- 6.4.19 Wan Hai Lines
- 6.4.20 Emirates Shipping Line
7 Market Opportunities & Future Outlook
- 7.1 White-space & Unmet-Need Assessment

