
PUBLISHER: Mordor Intelligence | PRODUCT CODE: 1911312

PUBLISHER: Mordor Intelligence | PRODUCT CODE: 1911312
Packaging - Market Share Analysis, Industry Trends & Statistics, Growth Forecasts (2026 - 2031)
The global packaging market size in 2026 is estimated at USD 1,220.36 billion, growing from 2025 value of USD 1,180 billion with 2031 projections showing USD 1,443.9 billion, growing at 3.42% CAGR over 2026-2031.
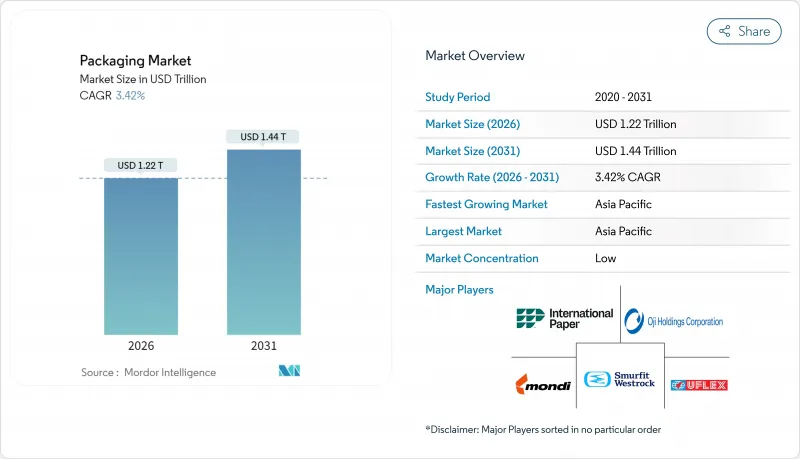
This steady expansion demonstrates how the global packaging market continues to mature while absorbing regulatory costs linked to circular-economy mandates and shifting consumer expectations that favor sustainability over pure cost-performance metrics. Demand resilience arises from packaging's irreplaceable protection, brand-building, and compliance functions across food, beverage, pharmaceuticals, and e-commerce channels. Asia-Pacific keeps capital intensity low through large-scale manufacturing, whereas developed regions invest in advanced recycling, mono-material films, and digital printing that enable near-real-time SKU launches. Meanwhile, e-commerce parcel growth, regulatory bans on single-use plastics, and corporate sustainability targets reinforce capital flows toward lighter materials, bio-based feedstocks, and on-demand customization platforms. Brands pursuing differentiation increasingly embed digital identifiers that support traceability, consumer engagement, and compliance with evolving extended producer responsibility (EPR) schemes.
Global Packaging Market Trends and Insights
Sustainability-Linked Purchasing Commitments Drive Material Innovation
Corporate mandates now specify minimum recycled content and confirmed recyclability, accelerating investment in molecular recycling plants and bio-based resins. Estee Lauder reached 71% compliance with its "5 Rs" packaging framework in 2024, illustrating how premium brands monetize sustainability narratives. Procurement teams embed carbon and recyclability metrics into supplier scorecards, a trend that aligns with forthcoming EPR fees that penalize hard-to-recycle formats. Certification programs such as the Association of Plastic Recyclers' design-for-recycling guidelines supply technical blueprints that shorten development cycles. As a result, resin suppliers scale depolymerization units that return PET and polyamide to virgin-grade feedstock, letting converters hit recycled-content targets without compromising shelf life. Investors reward companies that link executive bonuses to packaging footprint reductions, further institutionalizing sustainable-material adoption.
E-Commerce Parcel Volume Explosion Reshapes Protective Packaging
Urban fulfillment centers ship billions of single-item orders that face more handling steps than traditional store deliveries, heightening damage-prevention needs. Amazon's AI-driven pack-line optimization removed 95% of plastic air pillows, substituting paper cushioning that maintains product integrity and improves curbside recyclability. Automated right-sizing machinery now cuts custom corrugated blanks per order, trimming material use by up to 30% while slashing dimensional-weight fees. These volume dynamics elevate demand for lightweight flexible mailers with integrated tear strips and return seals. Digital presses print small-batch graphics that reinforce brand storytelling during unboxing. Consequently, converters capable of integrating data analytics with converting assets capture growing e-commerce wallet share, while traditional bulk shippers retrofit plants with new forming and sealing technologies.
Crude-Oil Price Volatility Impacts Resin Budgets
Polyethylene, polypropylene, and PET prices correlate strongly with Brent crude, creating unpredictable margin swings for converters on quarterly contracts. Sudden USD 10 per-barrel spikes in 2024 translated into double-digit resin surcharges inside four weeks, straining small extruders that lack hedging tools. Brand owners demanded fixed-price agreements, shifting cost risk downstream and prompting converters to accelerate recycled-content usage that follows a different price curve. Paperboard prices also climbed because higher diesel rates elevated transport costs and chemical inputs. The volatility steers capital toward regional resin suppliers and shortens supply chains, although capacity gaps persist in high-purity rPET pellets needed for food-grade applications.
Other drivers and restraints analyzed in the detailed report include:
- Brand-Owner Shift to Mono-Material Films Simplifies Recycling
- Regulatory Bans on Single-Use Plastics Accelerate Alternatives
- Rising Anti-Plastic Sentiment Shapes Brand Decisions
For complete list of drivers and restraints, kindly check the Table Of Contents.
Segment Analysis
Plastic packaging retained 41.55% of the global packaging market share in 2025 on the strength of its versatility, sealing speed, and cost efficiency. Yet paper packaging's 4.47% CAGR through 2031 outpaces overall global packaging market growth as regulators and brand charters privilege renewable fiber over petroleum-based substrates. The global packaging market size allocated to paper formats widens, supported by barrier coatings that now survive freezer-to-microwave cycles. Corrugated converters invest in digital single-pass presses that enable shelf-ready graphics, letting retailers skip additional display trays. Material substitution accelerates in quick-service food, where fiber bowls replace expanded polystyrene, and in confectionery multipacks that migrate from oriented polypropylene to recyclable coated paper.
The rigid plastics segment preserves traction via innovations in mono-material PET jars and HDPE bottles compatible with mechanical recycling, sustaining share in sauces, dairy, and home-care. Flexible plastic films enjoy e-commerce tailwinds owing to their low weight and tamper-evident seals. Meanwhile, metal cans face supply-chain limits as aerospace and automotive demand collide with packaging orders, driving cost pressure. Glass maintains niche roles in premium beverages but absorbs energy-price shocks that encourage light-weighting. Fiber growth continues as mills ramp high-performance linerboards capable of replacing bleached polyethylene-coated cartons, creating new value pools inside the global packaging market.
The Packaging Market Report is Segmented by Packaging Type (Plastic Packaging, Paper Packaging, Container Glass, Metal Cans and Containers), Packaging Format (Rigid, Flexible), End-Use Industry (Food, Beverage, Pharmaceuticals and Healthcare, Personal Care and Cosmetics, Industrial, E-Commerce), and Geography (North America, South America, Europe, and More). The Market Forecasts are Provided in Terms of Value (USD).
Geography Analysis
Asia-Pacific's 39.72% share reflects unparalleled manufacturing density plus rising disposable incomes that expand packaged food, beverage, and personal-care consumption. China dominates flexible film extrusion capacity, while India's blister-pack output meets growing pharmaceutical demand and exports to Africa. Mature markets like Japan and South Korea add value through high-precision converting, antimicrobial coatings, and digital embellishment. Indonesia and Vietnam scale corrugated plants to support electronics export hubs, fueling steady cartonboard demand.
Europe maintains leadership in eco-design, leveraging PPWR-driven mandates that incentivize source-reduced and recyclable solutions. Germany's closed-loop PET system achieves collection rates near 98%, offering a blueprint for other member states. France and Italy expand producer-responsibility schemes that reward post-consumer resin usage with fee discounts. Eastern Europe attracts flexible-packaging investments that balance wage competitiveness with EU market proximity, giving converters cost and compliance advantages.
North America's mature consumption drives consistent replacement demand, yet growth pockets emerge in omnichannel fulfillment. U.S. converters automate corrugated factories with robotics, meeting Amazon Frustration-Free guidelines for damage-free delivery. Canada's deposit systems support high-quality glass recycling that supplies craft beverage fillers, while Mexico's resin plants feed both domestic and U.S. markets, hedging against supply shocks.
Middle East and Africa accelerates as Saudi Arabia and UAE diversify economies; new megacities attract modern retail formats requiring sophisticated primary and secondary packaging. South Africa's collection infrastructure upgrades enable rPET availability, feeding regional bottle loops and embedding circular practices into the expanding global packaging market.
- Amcor plc
- International Paper Company
- Smurfit WestRock
- Ball Corporation
- Crown Holdings Inc.
- Mondi plc
- Oji Holdings Corporation
- UFlex Limited
- Huhtamaki Oyj
- Sealed Air Corporation
- Greif Inc.
- Sonoco Products Company
- AptarGroup Inc.
- ALPLA Group GmbH
- O-I Glass Inc.
- Verallia SE
- Vidrala S.A.
- Gerresheimer AG
- Vitro S.A.B. de C.V.
- Ardagh Group S.A.
- CANPACK S.A.
- Silgan Holdings Inc.
- AGI Glaspac
- Packman Packaging Pvt. Ltd.
- Tetra Pak International S.A.
Additional Benefits:
- The market estimate (ME) sheet in Excel format
- 3 months of analyst support
TABLE OF CONTENTS
1 INTRODUCTION
- 1.1 Study Assumptions and Market Definition
- 1.2 Scope of the Study
2 RESEARCH METHODOLOGY
3 EXECUTIVE SUMMARY
4 MARKET LANDSCAPE
- 4.1 Market Overview
- 4.2 Market Drivers
- 4.2.1 Sustainability-linked purchasing commitments
- 4.2.2 E-commerce parcel volume explosion
- 4.2.3 Brand-owner shift to mono-material films
- 4.2.4 Regulatory bans on single-use plastics
- 4.2.5 On-site digital print enabling SKU proliferation
- 4.2.6 Adoption of smart and connected packaging (IoT, QR, NFC-enabled solutions)
- 4.3 Market Restraints
- 4.3.1 Crude-oil price volatility impacting resin costs
- 4.3.2 Rising anti-plastic sentiment in developed economies
- 4.3.3 Aluminum can sheet supply tightness
- 4.3.4 Container-glass furnace energy inflation
- 4.4 Industry Value Chain Analysis
- 4.5 Regulatory Landscape
- 4.6 Technological Outlook
- 4.7 Porter's Five Forces Analysis
- 4.7.1 Threat of New Entrants
- 4.7.2 Bargaining Power of Suppliers
- 4.7.3 Bargaining Power of Buyers
- 4.7.4 Threat of Substitutes
- 4.7.5 Competitive Rivalry
- 4.8 The Impact of Macroeconomic Factors on the Market
5 MARKET SIZE & GROWTH FORECASTS (VALUE)
- 5.1 By Packaging Type
- 5.1.1 Plastic Packaging
- 5.1.1.1 By Type
- 5.1.1.1.1 Rigid Plastic Packaging
- 5.1.1.1.1.1 By Material Type
- 5.1.1.1.1.1.1 Polypropylene (PP)
- 5.1.1.1.1.1.2 Polyethylene Terephthalate (PET)
- 5.1.1.1.1.1.3 Polyvinyl Chloride (PVC)
- 5.1.1.1.1.1.4 Polystyrene (PS) and Expanded Polystyrene (EPS)
- 5.1.1.1.1.1.5 Other Material Types
- 5.1.1.1.1.2 By Product Type
- 5.1.1.1.1.2.1 Bottles and Jars
- 5.1.1.1.1.2.2 Caps and Closures
- 5.1.1.1.1.2.3 Trays and Containers
- 5.1.1.1.1.2.4 Other Product Types
- 5.1.1.1.1.3 By End-use Industry
- 5.1.1.1.1.3.1 Food
- 5.1.1.1.1.3.2 Beverage
- 5.1.1.1.1.3.3 Pharmaceutical
- 5.1.1.1.1.3.4 Cosmetics and Personal Care
- 5.1.1.1.1.3.5 Industrial
- 5.1.1.1.1.3.6 Other End-use Industries
- 5.1.1.1.1.1 By Material Type
- 5.1.1.1.2 Flexible Plastic Packaging
- 5.1.1.1.2.1 By Material Type
- 5.1.1.1.2.1.1 Polyethylene (PE)
- 5.1.1.1.2.1.2 Biaxially Oriented Polypropylene (BOPP)
- 5.1.1.1.2.1.3 Cast Polypropylene (CPP)
- 5.1.1.1.2.1.4 Other Material Types
- 5.1.1.1.2.2 By Product Type
- 5.1.1.1.2.2.1 Pouches and Bags
- 5.1.1.1.2.2.2 Films and Wraps
- 5.1.1.1.2.2.3 Other Product Types
- 5.1.1.1.2.3 By End-use Industry
- 5.1.1.1.2.3.1 Food
- 5.1.1.1.2.3.2 Beverage
- 5.1.1.1.2.3.3 Pharmaceutical
- 5.1.1.1.2.3.4 Cosmetics and Personal Care
- 5.1.1.1.2.3.5 Industrial
- 5.1.1.1.2.3.6 Other End-use Industries
- 5.1.1.1.2.1 By Material Type
- 5.1.1.1.1 Rigid Plastic Packaging
- 5.1.1.2 By Product Type
- 5.1.1.2.1 Bottles and Jars
- 5.1.1.2.2 Pouches and Bags
- 5.1.1.2.3 Bulk-Grade Products
- 5.1.1.2.4 Other Product Types
- 5.1.1.3 By End-use Industry
- 5.1.1.3.1 Food
- 5.1.1.3.2 Beverages
- 5.1.1.3.3 Cosmetics and Personal Care
- 5.1.1.3.4 Pharamceuticals
- 5.1.1.3.5 Industrial
- 5.1.1.3.6 Other End-use Industries
- 5.1.1.1 By Type
- 5.1.2 Paper Packaging
- 5.1.2.1 By Product Type
- 5.1.2.1.1 Folding Carton
- 5.1.2.1.2 Corrugated Boxes
- 5.1.2.1.3 Liquid Paperboard
- 5.1.2.1.4 Other Product Types
- 5.1.2.2 By End-use Industry
- 5.1.2.2.1 Food
- 5.1.2.2.2 Beverages
- 5.1.2.2.3 E-commerce
- 5.1.2.2.4 Other End-use Industry
- 5.1.2.1 By Product Type
- 5.1.3 Container Glass
- 5.1.3.1 By Color
- 5.1.3.1.1 Green
- 5.1.3.1.2 Amber
- 5.1.3.1.3 Flint
- 5.1.3.1.4 Other Colors
- 5.1.3.2 By End-use Industry
- 5.1.3.2.1 Food
- 5.1.3.2.2 Beverage
- 5.1.3.2.2.1 Alcoholic
- 5.1.3.2.2.2 Non-Alcoholic
- 5.1.3.2.3 Personal Care and Cosmetics
- 5.1.3.2.4 Pharmaceuticals (excluding Vials and Ampoules)
- 5.1.3.2.5 Perfumery
- 5.1.3.1 By Color
- 5.1.4 Metal Cans and Containers
- 5.1.4.1 By Material Type
- 5.1.4.1.1 Steel
- 5.1.4.1.2 Aluminum
- 5.1.4.2 By Product Type
- 5.1.4.2.1 Cans
- 5.1.4.2.2 Drums and Barrels
- 5.1.4.2.3 Caps and Closures
- 5.1.4.2.4 Other Product Types
- 5.1.4.3 By End-use Industry
- 5.1.4.3.1 Food
- 5.1.4.3.2 Beverage
- 5.1.4.3.3 Chemicals and Petroleum
- 5.1.4.3.4 Industrial
- 5.1.4.3.5 Paints and coatings
- 5.1.4.3.6 Other End-use Industries
- 5.1.4.1 By Material Type
- 5.1.1 Plastic Packaging
- 5.2 By Packaging Format
- 5.2.1 Rigid
- 5.2.2 Flexible
- 5.3 By End-Use Industry
- 5.3.1 Food
- 5.3.2 Beverage
- 5.3.3 Pharmaceuticals and Healthcare
- 5.3.4 Personal Care and Cosmetics
- 5.3.5 Industrial
- 5.3.6 E-commerce
- 5.3.7 Other End-use Industry
- 5.4 By Geography
- 5.4.1 North America
- 5.4.1.1 United States
- 5.4.1.2 Canada
- 5.4.1.3 Mexico
- 5.4.2 South America
- 5.4.2.1 Brazil
- 5.4.2.2 Argentina
- 5.4.2.3 Mexico
- 5.4.2.4 Rest of South America
- 5.4.3 Europe
- 5.4.3.1 Germany
- 5.4.3.2 France
- 5.4.3.3 United Kingdom
- 5.4.3.4 Italy
- 5.4.3.5 Spain
- 5.4.3.6 Poland
- 5.4.3.7 Rest of Europe
- 5.4.4 Asia-Pacific
- 5.4.4.1 China
- 5.4.4.2 India
- 5.4.4.3 Japan
- 5.4.4.4 Thailand
- 5.4.4.5 Australia
- 5.4.4.6 South Korea
- 5.4.4.7 Rest of Asia-Pacific
- 5.4.5 Middle East and Africa
- 5.4.5.1 Middle East
- 5.4.5.1.1 Saudi Arabia
- 5.4.5.1.2 United Arab Emirates
- 5.4.5.1.3 Turkey
- 5.4.5.1.4 Rest of Middle East
- 5.4.5.2 Africa
- 5.4.5.2.1 South Africa
- 5.4.5.2.2 Nigeria
- 5.4.5.2.3 Egypt
- 5.4.5.2.4 Rest of Africa
- 5.4.5.1 Middle East
- 5.4.1 North America
6 COMPETITIVE LANDSCAPE
- 6.1 Market Concentration
- 6.2 Strategic Moves
- 6.3 Market Share Analysis
- 6.4 Company Profiles (includes Global level Overview, Market level overview, Core Segments, Financials as available, Strategic Information, Market Rank/Share for key companies, Products and Services, and Recent Developments)
- 6.4.1 Amcor plc
- 6.4.2 International Paper Company
- 6.4.3 Smurfit WestRock
- 6.4.4 Ball Corporation
- 6.4.5 Crown Holdings Inc.
- 6.4.6 Mondi plc
- 6.4.7 Oji Holdings Corporation
- 6.4.8 UFlex Limited
- 6.4.9 Huhtamaki Oyj
- 6.4.10 Sealed Air Corporation
- 6.4.11 Greif Inc.
- 6.4.12 Sonoco Products Company
- 6.4.13 AptarGroup Inc.
- 6.4.14 ALPLA Group GmbH
- 6.4.15 O-I Glass Inc.
- 6.4.16 Verallia SE
- 6.4.17 Vidrala S.A.
- 6.4.18 Gerresheimer AG
- 6.4.19 Vitro S.A.B. de C.V.
- 6.4.20 Ardagh Group S.A.
- 6.4.21 CANPACK S.A.
- 6.4.22 Silgan Holdings Inc.
- 6.4.23 AGI Glaspac
- 6.4.24 Packman Packaging Pvt. Ltd.
- 6.4.25 Tetra Pak International S.A.
7 MARKET OPPORTUNITIES AND FUTURE OUTLOOK
- 7.1 White-space and Unmet-Need Assessment

