
PUBLISHER: Mordor Intelligence | PRODUCT CODE: 1911320

PUBLISHER: Mordor Intelligence | PRODUCT CODE: 1911320
Flex-fuel Vehicle - Market Share Analysis, Industry Trends & Statistics, Growth Forecasts (2026 - 2031)
Flex-fuel Vehicle market size in 2026 is estimated at USD 1102.88 billion, growing from 2025 value of USD 1130 billion with 2031 projections showing USD 976.12 billion, growing at -2.4% CAGR over 2026-2031.
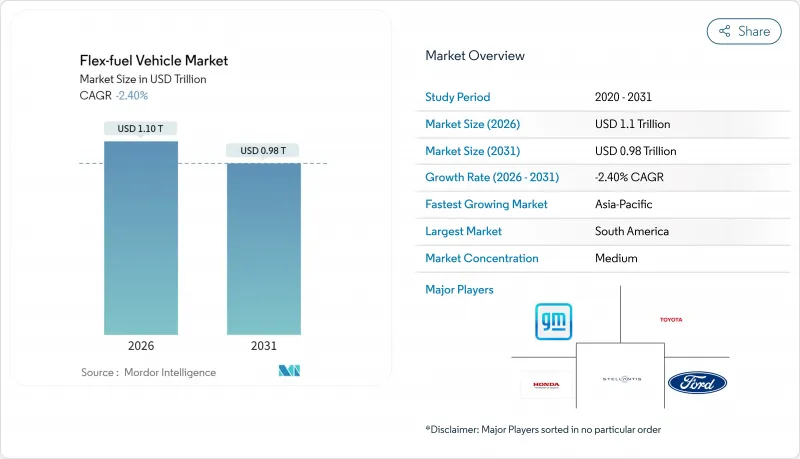
The downturn mirrors the auto sector's accelerated pivot toward battery-electric drivetrains and tightening regulations that favor zero-tailpipe-emission solutions over biofuel blending. OEMs are reassessing capital allocation as electric platforms capture the bulk of new-model investment, while policy instruments such as the European Union's 2035 combustion-engine phase-out and China's NEV quotas deepen the structural headwinds. South America remains the stronghold for the flex-fuel vehicle market, anchored by Brazil's RenovaBio carbon-credit incentives, yet even this region faces slower fleet renewals as hybrid-electric penetration rises. Passenger cars retain scale advantages that shield the segment from steeper volume loss, but commercial fleets are decelerating faster because total cost-of-ownership models increasingly favor electrification. Overall, the market's strategic relevance is shifting from growth opportunity to transition hedge amid a decarbonization agenda that prioritizes direct electrification.
Global Flex-fuel Vehicle Market Trends and Insights
E-10/E-15 global roll-outs in developing nations
Expanding blend mandates across India, Indonesia, and the Philippines are elevating ethanol demand as policymakers seek energy security and farm-income diversification. India's push toward one-fifth blending by 2026 is turning the country from a corn exporter into a net importer, thereby tightening global feedstock supply. Japan's roadmap for E-10 by 2030 and E-20 by 2040 underscores a coordinated Asian strategy that preserves internal-combustion options while EV infrastructure scales. Feedstock competition with poultry and livestock sectors is lifting input prices, exposing the delicate balance between fuel policy and food security. National oil companies remain critical facilitators of logistics and pricing, helping mitigate regional distribution constraints. Collectively, these programs deliver incremental tail-pipe CO2 cuts but struggle to reverse the flex-fuel vehicle market contraction amid simultaneous EV incentives.
Brazilian RenovaBio carbon-credit premiums
RenovaBio sets life-cycle-based carbon-credit benchmarks that monetize every incremental efficiency gain along the ethanol supply chain. Premiums for low-carbon CBIO certificates reached USD 115 per tonne-CO2e in early 2025, adding profitable revenue streams to sugarcane and corn ethanol plants. Expansion in Brazil's Center-West has already spawned 25 operating corn-ethanol mills with another 15 under construction, lifting total output to 8.2 billion liters for the 2024/25 harvest. The policy's technology-neutral framework favors best-in-class producers, incentivizing precision-agriculture inputs and waste-heat recovery systems. Petrobras' endorsement of higher ethanol blends under the "Fuel of the Future" law signals sustained state-backed support for the pathway. While RenovaBio softens revenue volatility tied to sugar prices, it cannot fully offset the macro shift toward electric alternatives.
Accelerated EV adoption targets in Europe & China
The European Union's 2035 combustion ban and China's escalating NEV quotas are redirecting automaker investment toward full electrification. Chinese brands already occupied 7.9% of EU battery-electric sales in 2023 and may capture 20% by 2027, amplifying competitive pressure. The European EV market is forecast to grow exponentially by 2030, a financial magnet that drains capital from biofuel platforms. China's cost advantage makes flex-fuel strategies appear economically inferior, reinforcing a feedback loop of policy, infrastructure, and consumer preference. As public charging networks expand, range anxiety wanes, further eroding flex-fuel defensibility. The restraint subtracts the largest single share from the flex-fuel vehicle market CAGR.
Other drivers and restraints analyzed in the detailed report include:
- Cellulosic-ethanol price inflection after U.S. 45Z credit
- OEM flex-strategy to hedge EV policy uncertainty
- OEM cap-ex re-allocation toward BEV platforms
For complete list of drivers and restraints, kindly check the Table Of Contents.
Segment Analysis
The E-25 to E-85 category held 48.55% of flex-fuel vehicle market size in 2025 and is forecast to slip at a -2.30% CAGR to 2031. Moderate blends thrive on existing filling-station pumps and engine calibrations that avoid costly hardware changes. Brazil's evaluation of E30 gasoline aligns with this sweet spot, leveraging a 20-million-vehicle fleet that seamlessly adapts to varying ethanol content. California's rapid E85 retail sales underscore how regional taxation and price incentives can nudge drivers toward higher biofuel mixes when economics allow. Yet research indicates E30 sits at the inflection point for low-speed pre-ignition control, where further ethanol raises engine-mapping complexity and cold-start risk. This practical ceiling guides OEM design choices and keeps mid-range blends the industry's default during the transition period.
High blends above E85, while showcasing maximum renewable content, demand dedicated fuel networks and carry energy-density penalties that erode driving range. Entry-level blends such as E10 or E15 aid markets that are still developing supply chains, but they deliver limited carbon reduction, reducing their strategic appeal under stringent emissions goals. The current hierarchy signals a pragmatic compromise between sustainability and infrastructural reality, even as electrification gains traction. Overall, ethanol blends between 25% and 85% will continue to dominate flex-fuel adoption through 2031, provided price differentials against gasoline remain attractive in high-production regions.
Passenger cars generated 64.52% of 2025 revenue and will taper at a slower -2.18% CAGR than commercial segments. Consumer preference for fuel choice, especially where ethanol trades at a discount, sustains baseline demand. Brazil's compact-car segment still counts flex-fuels as the default configuration, while India's Tata Punch Flex Fuel showcases innovation potential even in cost-sensitive markets. Light-commercial vans occupy an intermediate position, balancing payload needs with urban-zone regulations that are starting to penalize combustion engines. In contrast, heavy-duty trucks and buses are declining fastest as fleet operators shift capital toward battery-electric and hydrogen models that promise long-term operating savings.
The resilience of the passenger car cohort stems from decentralized refueling and individual price arbitrage behavior, both absent in centralized fleet procurement. Motorcycles offer an emerging niche, with Honda introducing flex-compatible engines that can utilize domestic ethanol streams in Southeast Asia. Still, rising urban clean-air rules and congestion charges are likely to accelerate the migration toward electric scooters and compact EVs. Consequently, passenger cars will preserve volume leadership in the flex-fuel vehicle market, yet the segment's strategic importance is expected to diminish over the next decade.
The Flex-Fuel Vehicle Market is Segmented by Ethanol Blend Type (E-10 To E-25, E-25 To E-85, E-85 and Above), Vehicle Type (Passenger Cars, Light Commercial Vehicles, and Heavy Commercial Vehicles), Fuel Type (Gasoline and Diesel-Compatible Dual-Fuel), Sales Channel (OEM-Fitted and Aftermarket Conversion Kits), and Geography. The Market Forecasts are Provided in Terms of Value (USD).
Geography Analysis
South America led with 42.10% share in 2025, powered by Brazil's integrated ethanol ecosystem, which includes more than 40,000 retail pumps and a robust CBIO carbon-credit market. The country's "Fuel of the Future" law raising mandatory blends to 35% keeps domestic demand buoyant, while corn-ethanol expansion diversifies feedstock risk. Stellantis' EUR 5.6 billion Bio-Hybrid investment underscores the region's role as a living laboratory for ethanol-electric synergy. Argentina and Paraguay supplement demand by importing sugarcane ethanol, anchoring a regional trade hub that stabilizes supply-chain economics.
Asia-Pacific, despite active blending policies, is the fastest-declining bloc at -2.23% CAGR through 2031. China's national focus on NEV roll-outs, coupled with provincial subsidies for battery-electric trucks, constrains flex-fuel investments. India's ethanol program faces feedstock headwinds as corn imports grow, dampening cost competitiveness. Japan's E-10 pledge provides policy certainty, but domestic automakers are channeling R&D into solid-state batteries, limiting flex-fuel output beyond niche sports models. Southeast Asian nations are exploring B40 biodiesel and ethanol pilots, yet EV incentives are starting to capture the urban consumer segment.
North America retains large ethanol production capacity supported by the 45Z credit, yet market penetration is flat because OEMs aim new product pipelines at electric platforms. California's zero-emission vehicle mandate accelerates this swing. Europe shows similar patterns: notwithstanding Germany's push for e-fuels carve-outs post-2035, the regulatory package overwhelmingly steers buyers toward BEVs.
In the Middle East and Africa, fuel diversification strategies tied to food-security and economic diversification provide modest openings, but infrastructure gaps and limited purchasing power restrain widespread uptake.
- Stellantis NV
- Volkswagen AG
- General Motors Co.
- Ford Motor Co.
- Toyota Motor Corp.
- Honda Motor Co.
- Hyundai Motor Co.
- Kia Corp.
- Nissan Motor Co.
- Renault SA
- Subaru Corp.
- BMW AG
- Volvo Car Corp.
- Tata Motors Ltd.
- Mahindra & Mahindra Ltd.
- SAIC Motor Corp.
- Great Wall Motor Co.
- Geely Automobile Holdings
- JAC Motors
- Changan Automobile
Additional Benefits:
- The market estimate (ME) sheet in Excel format
- 3 months of analyst support
TABLE OF CONTENTS
1 Introduction
- 1.1 Study Assumptions
- 1.2 Scope of the Study
2 Research Methodology
3 Executive Summary
4 Market Landscape
- 4.1 Market Overview
- 4.2 Market Drivers
- 4.2.1 E-10/E-15 Global Roll-Outs In Developing Nations
- 4.2.2 Brazilian Renovabio Carbon-Credit Premiums
- 4.2.3 Cellulosic-Ethanol Price Inflection After U.S. 45Z Credit
- 4.2.4 OEM Flex-Strategy To Hedge EV Policy Uncertainty
- 4.2.5 Next-Gen Port-Fuel-Injection Kits For Legacy Fleets
- 4.2.6 Ethanol-Compatible After-Treatment Cost Deflation
- 4.3 Market Restraints
- 4.3.1 Accelerated EV Adoption Targets In Europe & China
- 4.3.2 OEM Cap-Ex Re-Allocation Toward BEV Platforms
- 4.3.3 Limited Ethanol Feed-Stock In Drought-Prone Geographies
- 4.3.4 Cold-Start Emission Spikes In Sub-Zero Climates
- 4.4 Value / Supply-Chain Analysis
- 4.5 Regulatory Landscape
- 4.6 Technological Outlook
- 4.7 Porter's Five Forces
- 4.7.1 Bargaining Power of Suppliers
- 4.7.2 Bargaining Power of Consumers
- 4.7.3 Threat of New Entrants
- 4.7.4 Threat of Substitutes
- 4.7.5 Intensity of Competitive Rivalry
5 Market Size & Growth Forecasts (Value (USD))
- 5.1 By Ethanol Blend Type
- 5.1.1 E-10 to E-25
- 5.1.2 E-25 to E-85
- 5.1.3 E-85 and Above
- 5.2 By Vehicle Type
- 5.2.1 Passenger Cars
- 5.2.2 Light Commercial Vehicles
- 5.2.3 Heavy Commercial Vehicles
- 5.3 By Fuel Type
- 5.3.1 Gasoline
- 5.3.2 Diesel-compatible Dual-Fuel
- 5.4 By Sales Channel
- 5.4.1 OEM-fitted
- 5.4.2 Aftermarket Conversion Kits
- 5.5 By Geography
- 5.5.1 North America
- 5.5.1.1 United States
- 5.5.1.2 Canada
- 5.5.1.3 Rest of North America
- 5.5.2 South America
- 5.5.2.1 Brazil
- 5.5.2.2 Argentina
- 5.5.2.3 Rest of South America
- 5.5.3 Europe
- 5.5.3.1 Germany
- 5.5.3.2 France
- 5.5.3.3 United Kingdom
- 5.5.3.4 Spain
- 5.5.3.5 Rest of Europe
- 5.5.4 Asia-Pacific
- 5.5.4.1 China
- 5.5.4.2 India
- 5.5.4.3 Japan
- 5.5.4.4 South Korea
- 5.5.4.5 Rest of Asia-Pacific
- 5.5.5 Middle East and Africa
- 5.5.5.1 United Arab Emirates
- 5.5.5.2 Saudi Arabia
- 5.5.5.3 Turkey
- 5.5.5.4 Egypt
- 5.5.5.5 South Africa
- 5.5.5.6 Rest of Middle East and Africa
- 5.5.1 North America
6 Competitive Landscape
- 6.1 Market Concentration
- 6.2 Strategic Moves
- 6.3 Market Share Analysis
- 6.4 Company Profiles (includes Global Level Overview, Market Level Overview, Core Segments, Financials as Available, Strategic Information, Market Rank/Share for Key Companies, Products and Services, SWOT Analysis, and Recent Developments)
- 6.4.1 Stellantis NV
- 6.4.2 Volkswagen AG
- 6.4.3 General Motors Co.
- 6.4.4 Ford Motor Co.
- 6.4.5 Toyota Motor Corp.
- 6.4.6 Honda Motor Co.
- 6.4.7 Hyundai Motor Co.
- 6.4.8 Kia Corp.
- 6.4.9 Nissan Motor Co.
- 6.4.10 Renault SA
- 6.4.11 Subaru Corp.
- 6.4.12 BMW AG
- 6.4.13 Volvo Car Corp.
- 6.4.14 Tata Motors Ltd.
- 6.4.15 Mahindra & Mahindra Ltd.
- 6.4.16 SAIC Motor Corp.
- 6.4.17 Great Wall Motor Co.
- 6.4.18 Geely Automobile Holdings
- 6.4.19 JAC Motors
- 6.4.20 Changan Automobile
7 Market Opportunities & Future Outlook
- 7.1 White-space & Unmet-need Assessment

