
PUBLISHER: Mordor Intelligence | PRODUCT CODE: 1911364

PUBLISHER: Mordor Intelligence | PRODUCT CODE: 1911364
Hydrogen Generation - Market Share Analysis, Industry Trends & Statistics, Growth Forecasts (2026 - 2031)
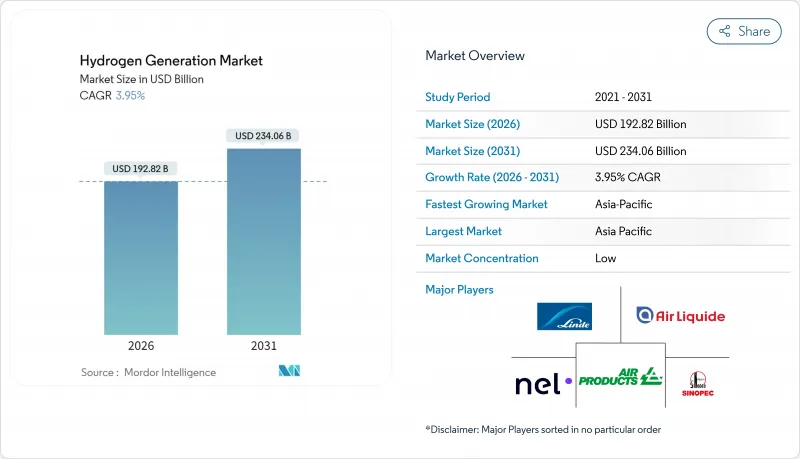
The Hydrogen Generation Market was valued at USD 185.49 billion in 2025 and estimated to grow from USD 192.82 billion in 2026 to reach USD 234.06 billion by 2031, at a CAGR of 3.95% during the forecast period (2026-2031).
This expansion occurs as policy-backed demand for low-carbon molecules displaces fossil-derived supply, accelerating investment in electrolysis and carbon-capture retrofits. Regulatory mechanisms such as the European Union's Renewable Fuels of Non-Biological Origin (RFNBO) rules and the United States' Section 45V production tax credit turn voluntary decarbonization efforts into compliance obligations, giving the hydrogen generation market a predictable revenue base. Technology costs reset as renewable electricity prices fall and electrolyzer gigafactories scale while carbon-pricing regimes widen the cost gap between grey and clean molecules. Simultaneously, industrial sectors-including steel, ammonia, and methanol-lock in long-term offtake contracts that de-risk gigawatt-scale projects and diversify the hydrogen generation market beyond its historical refinery focus.
Global Hydrogen Generation Market Trends and Insights
EU RFNBO mandate igniting certified green hydrogen demand
The RFNBO framework obliges refineries, chemical plants, and steelmakers to source verified renewable hydrogen, turning green molecules into compliance commodities. The inaugural €720 million auction narrowed the cost gap between fossil-based and renewable supply, enabling final investment decisions for gigawatt-scale electrolyzer arrays. Certification rules on additionality and temporal correlation differentiate premium product grades and trigger dedicated renewable PPAs. Utilities such as EWE are installing a 280 MW electrolyzer linked to onshore wind parks, with commissioning slated for 2027. Structured offtake contracts underpin project finance and give equipment vendors multi-year order visibility.
U.S. Section 45V tax credit accelerating domestic electrolyzer build-out
Finalized in January 2025, Section 45V grants up to USD 3 per kilogram for hydrogen produced below 4 kg CO2-e/kg, instantly moving many U.S. projects into the money. The three-tier incentive rewards hourly renewable matching, fostering grid-scale storage and advanced energy-management systems. Nel ASA secured federal funding to expand its Mississippi electrolyzer plant, while Plug Power landed a 3 GW equipment order for an Australian green ammonia scheme, demonstrating the global manufacturing scale driven by U.S. policy. Ten-year credit certainty unlocks long-dated PPAs, though developers model political-change scenarios to hedge downside risk.
Scarcity of tier-1 renewable PPAs for GW electrolysis
Only a small fraction of Europe's 130 GW electrolyzer pipeline has locked financing because developers cannot secure long-duration renewable PPAs at competitive prices. Data centers, EV charging networks, and traditional industry chase the same certified power, cutting into hydrogen project margins. Germany's nationwide hydrogen trunkline tariff of €25 per kWh and the Netherlands' 4% green-use mandate further elevate PPA premiums. Unless offshore wind auctions accelerate, many projects will slip beyond 2027, compressing the short-term delivery schedule.
Other drivers and restraints analyzed in the detailed report include:
- China's coal-to-hydrogen blending policy maintaining legacy volumes
- Middle East ammonia hubs catalyzing GW-scale export projects
- Gulf-Coast water stress constraining PEM roll-outs
For complete list of drivers and restraints, kindly check the Table Of Contents.
Segment Analysis
Grey hydrogen supplied 97.21% of global demand in 2025, cementing the historical reliance on steam methane reforming and coal gasification. That dominance masks the breakout trajectory of electrolytic supply, with green volumes projected to climb at a 32.6% CAGR by 2031. This surge shifts procurement patterns as compliance-driven customers carve out renewable-only contract pools. The hydrogen generation market size for green output is expected to expand most in Europe and North America, where policy incentives offset higher levelized costs. Legacy asset owners retrofit carbon capture on select plants to secure low-carbon certificates, while project developers bundle renewable PPAs and pipeline access into long-term supply contracts.
Blue hydrogen is an interim bridge, particularly in gas-rich regions that can leverage depleted reservoirs for CO2 storage. Turquoise pathways, producing solid carbon coproducts, attract venture funding but remain pre-commercial. Pink hydrogen retains a niche among countries with high nuclear capacity and limited renewable land availability, giving utilities a baseload decarbonization option without intermittency risk. Each pathway's maturation timeline influences investment sequencing, creating optionality for diversified portfolios within the hydrogen generation market.
The Hydrogen Generation Market Report is Segmented by Source (Grey Hydrogen, Blue Hydrogen, Green Hydrogen, and Others), Technology (Steam Methane Reforming, Coal Gasification, Electrolysis, and Others), Application (Oil Refining, Chemical Processing, Iron and Steel, Transportation Fuel, Power and Energy Storage, and Others), and Geography (North America, Europe, Asia-Pacific, South America, and Middle East and Africa).
Geography Analysis
Asia-Pacific controlled 54.08% of global revenue in 2025, anchored by China's extensive coal-gasification fleet and accelerated electrolyzer uptake. Beijing's dual-track model sustains existing grey output while underwriting the world's largest dedicated hydrogen pipeline between Inner Mongolia and coastal industrial zones. India's National Green Hydrogen Mission, backed by viability-gap funding and import-duty waivers on electrolyzer stacks, positions the country as the next big growth frontier. High-solar-irradiance ASEAN nations, notably Indonesia and Malaysia, develop export-oriented ammonia corridors linked to Japanese and Korean buyers.
Europe ranks second in market size but first in policy intensity. RFNBO quotas, a €24 billion German backbone pipeline, and hydrogen-based steel ventures like HYBRIT move the region toward large-scale clean-molecule adoption. Project bottlenecks stem largely from scarce low-cost renewable PPAs, although accelerated offshore-wind auction schedules aim to unlock additional capacity. Nordic hydropower gives Scandinavian electrolyzer projects a stable, low-carbon electricity supply, lowering delivered-hydrogen costs relative to continental peers.
North America benefits from Section 45V incentives, abundant wind-solar resources, and established industrial clusters along the Gulf Coast and Midwest. Canadian carbon-pricing policies and hydro-rich provinces support export-grade clean-ammonia projects targeting Asia and Europe. Water stewardship and permitting timelines remain the key gating items for U.S. developers, especially in arid Western states. The Middle East develops GW-scale integrated hubs in Saudi Arabia, Oman, and the United Arab Emirates, using competitive renewables to ship green ammonia along existing tanker routes. Africa's nascent pipeline focuses on Namibia and Mauritania, where world-class solar resources, land availability, and EU proximity combine to attract early-stage capital.
- Linde plc
- Air Liquide
- Air Products & Chemicals
- Sinopec
- Engie SA
- Nel ASA
- Cummins Inc.
- ITM Power plc
- Plug Power Inc.
- Siemens Energy AG
- McPhy Energy SA
- FuelCell Energy
- Enapter AG
- Bloom Energy
- Ballard Power Systems
- Johnson Matthey PLC
- Kawasaki Heavy Industries
- Messer Group GmbH
- Taiyo Nippon Sanso Corp.
- Doosan Fuel Cell
Additional Benefits:
- The market estimate (ME) sheet in Excel format
- 3 months of analyst support
TABLE OF CONTENTS
1 Introduction
- 1.1 Study Assumptions & Market Definition
- 1.2 Scope of the Study
2 Research Methodology
3 Executive Summary
4 Market Landscape
- 4.1 Market Overview
- 4.2 Market Drivers
- 4.2.1 EU RFNBO Mandate Accelerating Green Hydrogen Off-take Agreements
- 4.2.2 IRA & U.S. Section 45V Tax Credits Boosting Domestic Electrolyser Build-out
- 4.2.3 China's Coal-to-Hydrogen Blending Policy Sustaining Grey & Blue Projects
- 4.2.4 Middle-East Ammonia Export Hubs Creating Demand for GW-scale Green Hydrogen
- 4.2.5 Nordic Steelmakers' HySustain Programs
- 4.2.6 Japan-Australia Liquefied Hydrogen Supply-chain (HESC)
- 4.3 Market Restraints
- 4.3.1 Scarcity of Tier-1 Renewable PPAs for GW-scale Electrolysis in Europe
- 4.3.2 U.S. Gulf-Coast Water-Stress Constraints on PEM Deployment
- 4.3.3 High CO2 Capture Costs for Existing SMR Units in South Korea
- 4.3.4 Limited Hydrogen Pipeline Codes & Safety Permits in Caribbean Islands
- 4.4 Supply-Chain Analysis
- 4.5 Regulatory Landscape
- 4.6 Technological Outlook
- 4.7 Porter's Five Forces Analysis
- 4.7.1 Bargaining Power of Suppliers
- 4.7.2 Bargaining Power of Buyers
- 4.7.3 Threat of New Entrants
- 4.7.4 Threat of Substitutes
- 4.7.5 Intensity of Competitive Rivalry
5 Market Size & Growth Forecasts
- 5.1 By Source
- 5.1.1 Grey Hydrogen
- 5.1.2 Blue Hydrogen
- 5.1.3 Green Hydrogen
- 5.1.4 Turquoise Hydrogen
- 5.1.5 Pink Hydrogen
- 5.2 By Technology
- 5.2.1 Steam Methane Reforming (SMR)
- 5.2.2 Coal Gasification
- 5.2.3 Auto-Thermal Reforming (ATR)
- 5.2.4 Partial Oxidation (POX)
- 5.2.5 Electrolysis (Alkaline Electrolysis, Proton Exchange Membrane (PEM), Solid Oxide Electrolysis (SOE))
- 5.3 By Application
- 5.3.1 Oil Refining
- 5.3.2 Chemical Processing (Ammonia, Methanol)
- 5.3.3 Iron and Steel (DRI, H2-BF)
- 5.3.4 Transportation Fuel (FCEV, Marine, Aviation)
- 5.3.5 Power and Energy Storage
- 5.3.6 Residential and Commercial Heating
- 5.4 By Geography
- 5.4.1 North America
- 5.4.1.1 United States
- 5.4.1.2 Canada
- 5.4.1.3 Mexico
- 5.4.2 Europe
- 5.4.2.1 United Kingdom
- 5.4.2.2 Germany
- 5.4.2.3 France
- 5.4.2.4 Spain
- 5.4.2.5 Nordics
- 5.4.2.6 Turkey
- 5.4.2.7 Russia
- 5.4.2.8 Rest of Europe
- 5.4.3 Asia-Pacific
- 5.4.3.1 China
- 5.4.3.2 India
- 5.4.3.3 Japan
- 5.4.3.4 South Korea
- 5.4.3.5 ASEAN Countries
- 5.4.3.6 Australia
- 5.4.3.7 Rest of Asia-Pacific
- 5.4.4 South America
- 5.4.4.1 Brazil
- 5.4.4.2 Argentina
- 5.4.4.3 Rest of South America
- 5.4.5 Middle East and Africa
- 5.4.5.1 United Arab Emirates
- 5.4.5.2 Saudi Arabia
- 5.4.5.3 Egypt
- 5.4.5.4 South Africa
- 5.4.5.5 Rest of Middle East and Africa
- 5.4.1 North America
6 Competitive Landscape
- 6.1 Market Concentration
- 6.2 Strategic Moves (M&A, Partnerships, PPAs)
- 6.3 Market Share Analysis (Market Rank/Share for key companies)
- 6.4 Company Profiles (includes Global level Overview, Market level overview, Core Segments, Financials as available, Strategic Information, Products & Services, and Recent Developments)
- 6.4.1 Linde plc
- 6.4.2 Air Liquide
- 6.4.3 Air Products & Chemicals
- 6.4.4 Sinopec
- 6.4.5 Engie SA
- 6.4.6 Nel ASA
- 6.4.7 Cummins Inc.
- 6.4.8 ITM Power plc
- 6.4.9 Plug Power Inc.
- 6.4.10 Siemens Energy AG
- 6.4.11 McPhy Energy SA
- 6.4.12 FuelCell Energy
- 6.4.13 Enapter AG
- 6.4.14 Bloom Energy
- 6.4.15 Ballard Power Systems
- 6.4.16 Johnson Matthey PLC
- 6.4.17 Kawasaki Heavy Industries
- 6.4.18 Messer Group GmbH
- 6.4.19 Taiyo Nippon Sanso Corp.
- 6.4.20 Doosan Fuel Cell
7 Market Opportunities & Future Outlook
- 7.1 White-Space & Unmet-Need Assessment

