
PUBLISHER: Mordor Intelligence | PRODUCT CODE: 1911491

PUBLISHER: Mordor Intelligence | PRODUCT CODE: 1911491
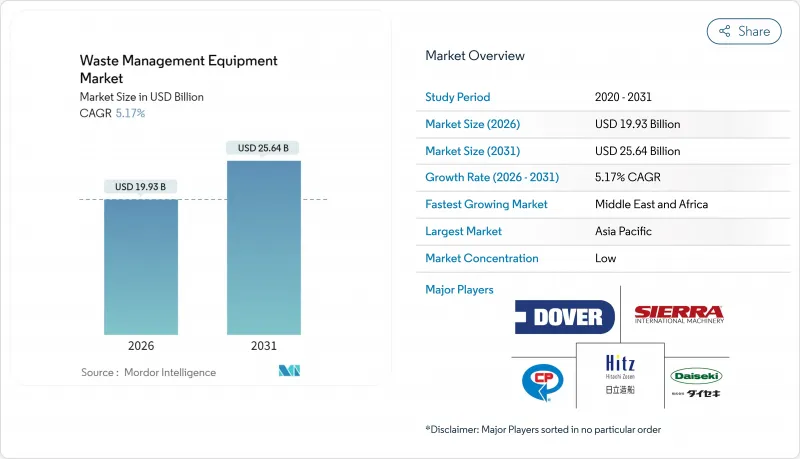
Waste Management Equipment - Market Share Analysis, Industry Trends & Statistics, Growth Forecasts (2026 - 2031)
The Waste Management Equipment market was valued at USD 18.95 billion in 2025 and estimated to grow from USD 19.93 billion in 2026 to reach USD 25.64 billion by 2031, at a CAGR of 5.17% during the forecast period (2026-2031).
Growing municipal solid-waste (MSW) volumes, stricter landfill-diversion policies, and rising investment in recycling infrastructure are accelerating equipment demand. Rapid urbanization in Asia and Africa keeps collection and processing capacity under pressure, while electronics-enabled automation upgrades remain the quickest path to cost reduction and compliance. Commodity price volatility and cybersecurity risks temper profitability, but equipment-as-a-service and green-procurement mandates open fresh revenue streams for vendors across the Global Waste Management Equipment market.
Global Waste Management Equipment Market Trends and Insights
Rapid Urbanization & MSW Surge
Expanding metropolitan populations generate waste volumes that grow faster than headcounts, pushing municipalities to upgrade fleets, transfer stations, and material-recovery facilities. The World Bank projects global MSW generation to rise 70% by 2050, widening infrastructure gaps in Sub-Saharan Africa and South Asia. Integrated systems cut the USD 375 per-ton societal cost of unmanaged waste to USD 50-100 per ton when collection, sorting, and processing are combined. Japanese examples such as Kitakyushu show that citizen engagement paired with real-time monitoring can decouple economic growth from waste output. As a result, urban areas allocate bigger budgets to smart bins, optical sorters, and electric refuse trucks, keeping the Global Waste Management Equipment market on a steady capacity-addition path.
Stringent Landfill-Diversion Regulations
California's SB 1383 targets a 75% organic-waste recycling rate by 2025, while the U.S. EPA mandates gas-collection systems for landfills larger than 2.5 million Mg, prompting upgrades in blowers, flare stacks, and monitoring gear. Municipalities such as Sacramento have already lifted organic diversion by 14% after installing high-volume composters. Construction and demolition ordinances in San Diego and King County set 65% recovery thresholds, steering builders toward specialized crushers and screeners. These rules establish predictable replacement cycles, forcing equipment buyers to favor platforms that prove diversion metrics, especially automated sorting lines, now central to compliance strategies across the Global Waste Management Equipment industry.
High Upfront CAPEX of Advanced Equipment
Fully automated sorting lines can cost 200-300% more than manual systems, presenting prohibitive hurdles for smaller cities. Fleet electrification offers similar sticker shock: one California regional district calculated USD 5.7 million for trucks and USD 0.77 million for chargers to electrify 96 vehicles. Grants, tax credits, and utility rebates soften the blow, yet many buyers still delay modernization. EaaS contracts now offset CAPEX, but they do not erase budget limits, slowing near-term Global Waste Management Equipment market penetration until financing norms mature.
Other drivers and restraints analyzed in the detailed report include:
- Circular-Economy Recycling Investments
- AI-Powered Autonomous Sorting Robots
- Volatile Secondary-Commodity Prices
For complete list of drivers and restraints, kindly check the Table Of Contents.
Segment Analysis
Recycling and sorting machinery captured 68.21% Global Waste Management Equipment market share in 2025, signifying a structural pivot from disposal toward resource recovery. Optical sorters, ballistic separators, and AI-vision robots increasingly replace manual lines to meet diversion targets and lower contamination penalties. Regulations in the EU and select U.S. states impose minimum recycled-content mandates, creating a pull-through effect for high-purity processing gear. Vendors highlight modularity, allowing facilities to add containers, plastics, or fiber lines without large civil works costs. The segment also benefits from corporate net-zero pledges that raise demand for post-consumer recyclate.
Waste disposal equipment trails in volume but is expected to post the fastest 7.05% CAGR to 2031, driven by waste-to-energy and carbon-capture upgrades. Babcock & Wilcox's front-end design for Alberta's first CCS-equipped plant illustrates a future where incinerators double as emissions-mitigation assets. Landfill-gas systems, bio-dryers, and anaerobic digesters complete a diversified disposal toolkit, complementing recycling rather than competing with it. As organic diversion tightens, food-waste depackagers and composting drums expand their product breadth, amplifying cross-sell opportunities throughout the Global Waste Management Equipment market.
Non-hazardous flows constituted 90.08% of the Global Waste Management Equipment market size in 2025, reflecting ubiquitous MSW and commercial waste volumes. Standardized carts, rear-loaders, and transfer stations achieve economies of scale, allowing bulk orders and shared parts inventories. However, the EPA's forthcoming e-Manifest electronic tracking rule boosts hazardous-waste equipment growth to a 6.41% CAGR, spurring demand for sealed roll-offs, negative-pressure containers, and bar-code readers capable of compliant data capture.
Specialization yields a higher margin for hazardous-waste equipment makers, who integrate leak-detection sensors and remote monitoring to meet stricter safety codes. Partnerships such as Copenhagen Atomics and DeepGeo spotlight cutting-edge radioactive-material handling solutions. Meanwhile, non-hazardous systems welcome AI-retrofits for mixed-plastic streams and wet organics, improving throughput and material quality. Dual-track growth ensures comprehensive product portfolios remain central to vendor competitiveness across the Global Waste Management Equipment market.
The Waste Management Equipment Market Report is Segmented by Source (Residential, Commercial, Industrial, and More), by Service Type (Collection, Transportation, Sorting & Segregation, and More), by Waste Type (Municipal Solid, Industrial Hazardous Waste, E-Waste, and More), and by Geography (North America, South America, Europe, Asia-Pacific and Middle East and Africa). The Market Forecasts are Provided in Terms of Value (USD).
Geography Analysis
Asia-Pacific held 44.12% of the Global Waste Management Equipment market in 2025, anchored by China's and India's urban populations that eclipse 1.5 billion residents combined. National five-year plans prioritize solid-waste capacity, prompting orders for optical sorters and refuse-derived-fuel lines. South Korea's AI-robot exports illustrate regional leadership in automation, while Japan's citizen-engagement model shows the gains possible from meticulous source separation. Supply-chain proximity also benefits equipment vendors, as China is forecast to provide almost 45% of the world's scrap steel by 2050, supporting regional circular-economy projects.
North America remains a steady replacement market where emission caps and organics bans stimulate upgrades. California's organic-diversion law and Canada's first CCS-enabled waste-to-energy plant foster demand for digesters, conveyors, and gas-cleanup skids. Federal grants financing battery-electric refuse fleets accelerate fleet turnover, aligning with corporate carbon pledges. Europe follows similar patterns: extended-producer-responsibility schemes push recyclate purity thresholds, requiring AI-vision retrofits and high-speed ballistic separators.
The Middle East & Africa posts the fastest 6.48% CAGR to 2031 as Gulf Cooperation Council states modernize waste infrastructure to meet Vision 2030 agendas. New plants often leapfrog to the latest designs, opting straight for automated lines rather than incremental upgrades. Public-private concession models in Saudi Arabia and the UAE stabilize revenue streams, lowering investment risk for multinationals. Sub-Saharan cities adopt modular transfer stations and mobile balers to overcome capital constraints, broadening vendor opportunities across the Global Waste Management Equipment market.
- Wastequip LLC
- Dover Corp. (Environmental Solutions Group)
- TOMRA Systems ASA
- CP Manufacturing Inc.
- Bollegraaf Recycling Solutions
- Recycling Equipment Manufacturing Inc.
- Sierra International Machinery LLC
- Daiseki Co. Ltd.
- Hitachi Zosen Corp.
- Morita Holding Corp.
- Veolia Environnement SA
- SUEZ SA
- Waste Management Inc.
- Republic Services Inc.
- Stericycle Inc.
- Babcock & Wilcox Enterprises
- Alfa Laval AB
- ANDRITZ AG
- Terex Corporation
- EcoGreen Equipment
- TANA Oy
Additional Benefits:
- The market estimate (ME) sheet in Excel format
- 3 months of analyst support
TABLE OF CONTENTS
1 Introduction
- 1.1 Study Assumptions & Market Definition
- 1.2 Scope of the Study
2 Research Methodology
3 Executive Summary
4 Market Landscape
- 4.1 Market Overview
- 4.2 Market Drivers
- 4.2.1 Rapid urbanisation & MSW surge
- 4.2.2 Stringent landfill-diversion regulations
- 4.2.3 Circular-economy recycling investments
- 4.2.4 AI-powered autonomous sorting robots
- 4.2.5 Green public-procurement mandates for smart trucks
- 4.2.6 Equipment-as-a-Service financing models
- 4.3 Market Restraints
- 4.3.1 High upfront CAPEX of advanced equipment
- 4.3.2 Volatile secondary-commodity prices
- 4.3.3 Cyber-security risks in smart waste platforms
- 4.3.4 Shortage of skilled service technicians
- 4.4 Value / Supply-Chain Analysis
- 4.5 Regulatory Landscape
- 4.6 Technological Outlook
- 4.7 Industry Attractiveness - Porter's Five Force Analysis
- 4.7.1 Threat of New Entrants
- 4.7.2 Bargaining Power of Suppliers
- 4.7.3 Bargaining Power of Buyers
- 4.7.4 Threat of Substitutes
- 4.7.5 Intensity of Competitive Rivalry
5 Market Size & Growth Forecasts (Values, In USD Billion)
- 5.1 By Product Type
- 5.1.1 Waste Disposal Equipment
- 5.1.2 Waste Recycling & Sorting Equipment
- 5.2 By Waste Type
- 5.2.1 Hazardous
- 5.2.2 Non-Hazardous
- 5.3 By Application
- 5.3.1 Residential & Commercial Waste
- 5.3.2 Industrial Waste (Hazardous & Non-Hazardous)
- 5.3.3 Construction & Demolition Waste
- 5.3.4 Healthcare Waste
- 5.3.5 Others(Agriculture Waste, Mining & Extraction Waste, etc.)
- 5.4 By Technology
- 5.4.1 Manual
- 5.4.2 Semi-Automated
- 5.4.3 Fully Automated(Smart IoT / AI-Enabled, etc.)
- 5.5 By Geography
- 5.5.1 North America
- 5.5.1.1 United States
- 5.5.1.2 Canada
- 5.5.1.3 Mexico
- 5.5.2 South America
- 5.5.2.1 Brazil
- 5.5.2.2 Argentina
- 5.5.2.3 Peru
- 5.5.2.4 Rest of South America
- 5.5.3 Europe
- 5.5.3.1 United Kingdom
- 5.5.3.2 Germany
- 5.5.3.3 France
- 5.5.3.4 Italy
- 5.5.3.5 Spain
- 5.5.3.6 BENELUX (Belgium, Netherlands, and Luxembourg)
- 5.5.3.7 NORDICS (Denmark, Finland, Iceland, Norway, and Sweden)
- 5.5.3.8 Rest of Europe
- 5.5.4 Asia-Pacific
- 5.5.4.1 China
- 5.5.4.2 India
- 5.5.4.3 Japan
- 5.5.4.4 Australia
- 5.5.4.5 South Korea
- 5.5.4.6 ASEAN (Indonesia, Thailand, Philippines, Malaysia, Vietnam)
- 5.5.4.7 Rest of Asia-Pacific
- 5.5.5 Middle East and Africa
- 5.5.5.1 Saudi Arabia
- 5.5.5.2 United Arab Emirates
- 5.5.5.3 Qatar
- 5.5.5.4 Kuwait
- 5.5.5.5 Turkey
- 5.5.5.6 Egypt
- 5.5.5.7 South Africa
- 5.5.5.8 Nigeria
- 5.5.5.9 Rest of Middle East and Africa
- 5.5.1 North America
6 Competitive Landscape
- 6.1 Market Concentration
- 6.2 Strategic Moves
- 6.3 Market Share Analysis
- 6.4 Company Profiles (includes Global level Overview, Market level overview, Core Segments, Financials as available, Strategic Information, Products & Services, and Recent Developments)
- 6.4.1 Wastequip LLC
- 6.4.2 Dover Corp. (Environmental Solutions Group)
- 6.4.3 TOMRA Systems ASA
- 6.4.4 CP Manufacturing Inc.
- 6.4.5 Bollegraaf Recycling Solutions
- 6.4.6 Recycling Equipment Manufacturing Inc.
- 6.4.7 Sierra International Machinery LLC
- 6.4.8 Daiseki Co. Ltd.
- 6.4.9 Hitachi Zosen Corp.
- 6.4.10 Morita Holding Corp.
- 6.4.11 Veolia Environnement SA
- 6.4.12 SUEZ SA
- 6.4.13 Waste Management Inc.
- 6.4.14 Republic Services Inc.
- 6.4.15 Stericycle Inc.
- 6.4.16 Babcock & Wilcox Enterprises
- 6.4.17 Alfa Laval AB
- 6.4.18 ANDRITZ AG
- 6.4.19 Terex Corporation
- 6.4.20 EcoGreen Equipment
- 6.4.21 TANA Oy
7 Market Opportunities & Future Outlook
- 7.1 White-space & Unmet-Need Assessment

